

In the early days of my career, when I worked in B2B brand, I managed the social media channels for my brand. During my tenure, our share of voice grew from 6% to 65% in 6 months. Quoted on its own, that number fascinated leadership. On a closer look, though, it had nothing to do with what I did. It came from a brand relaunch campaign, and the majority of the comments were negative. Suffice it to say that part never went to leadership, and every time I presented the number, I prayed no one would ask for the sentiment analysis.
It is planning season again, so somewhere a 2027 deck has a share-of-voice chart in it. The line goes up. Underneath sits a rule that makes the line sound important. Brands whose share of voice runs ahead of their share of market tend to grow, by roughly half a point of share a year for every 10 points they are ahead. Finance nods, because it sounds like physics.
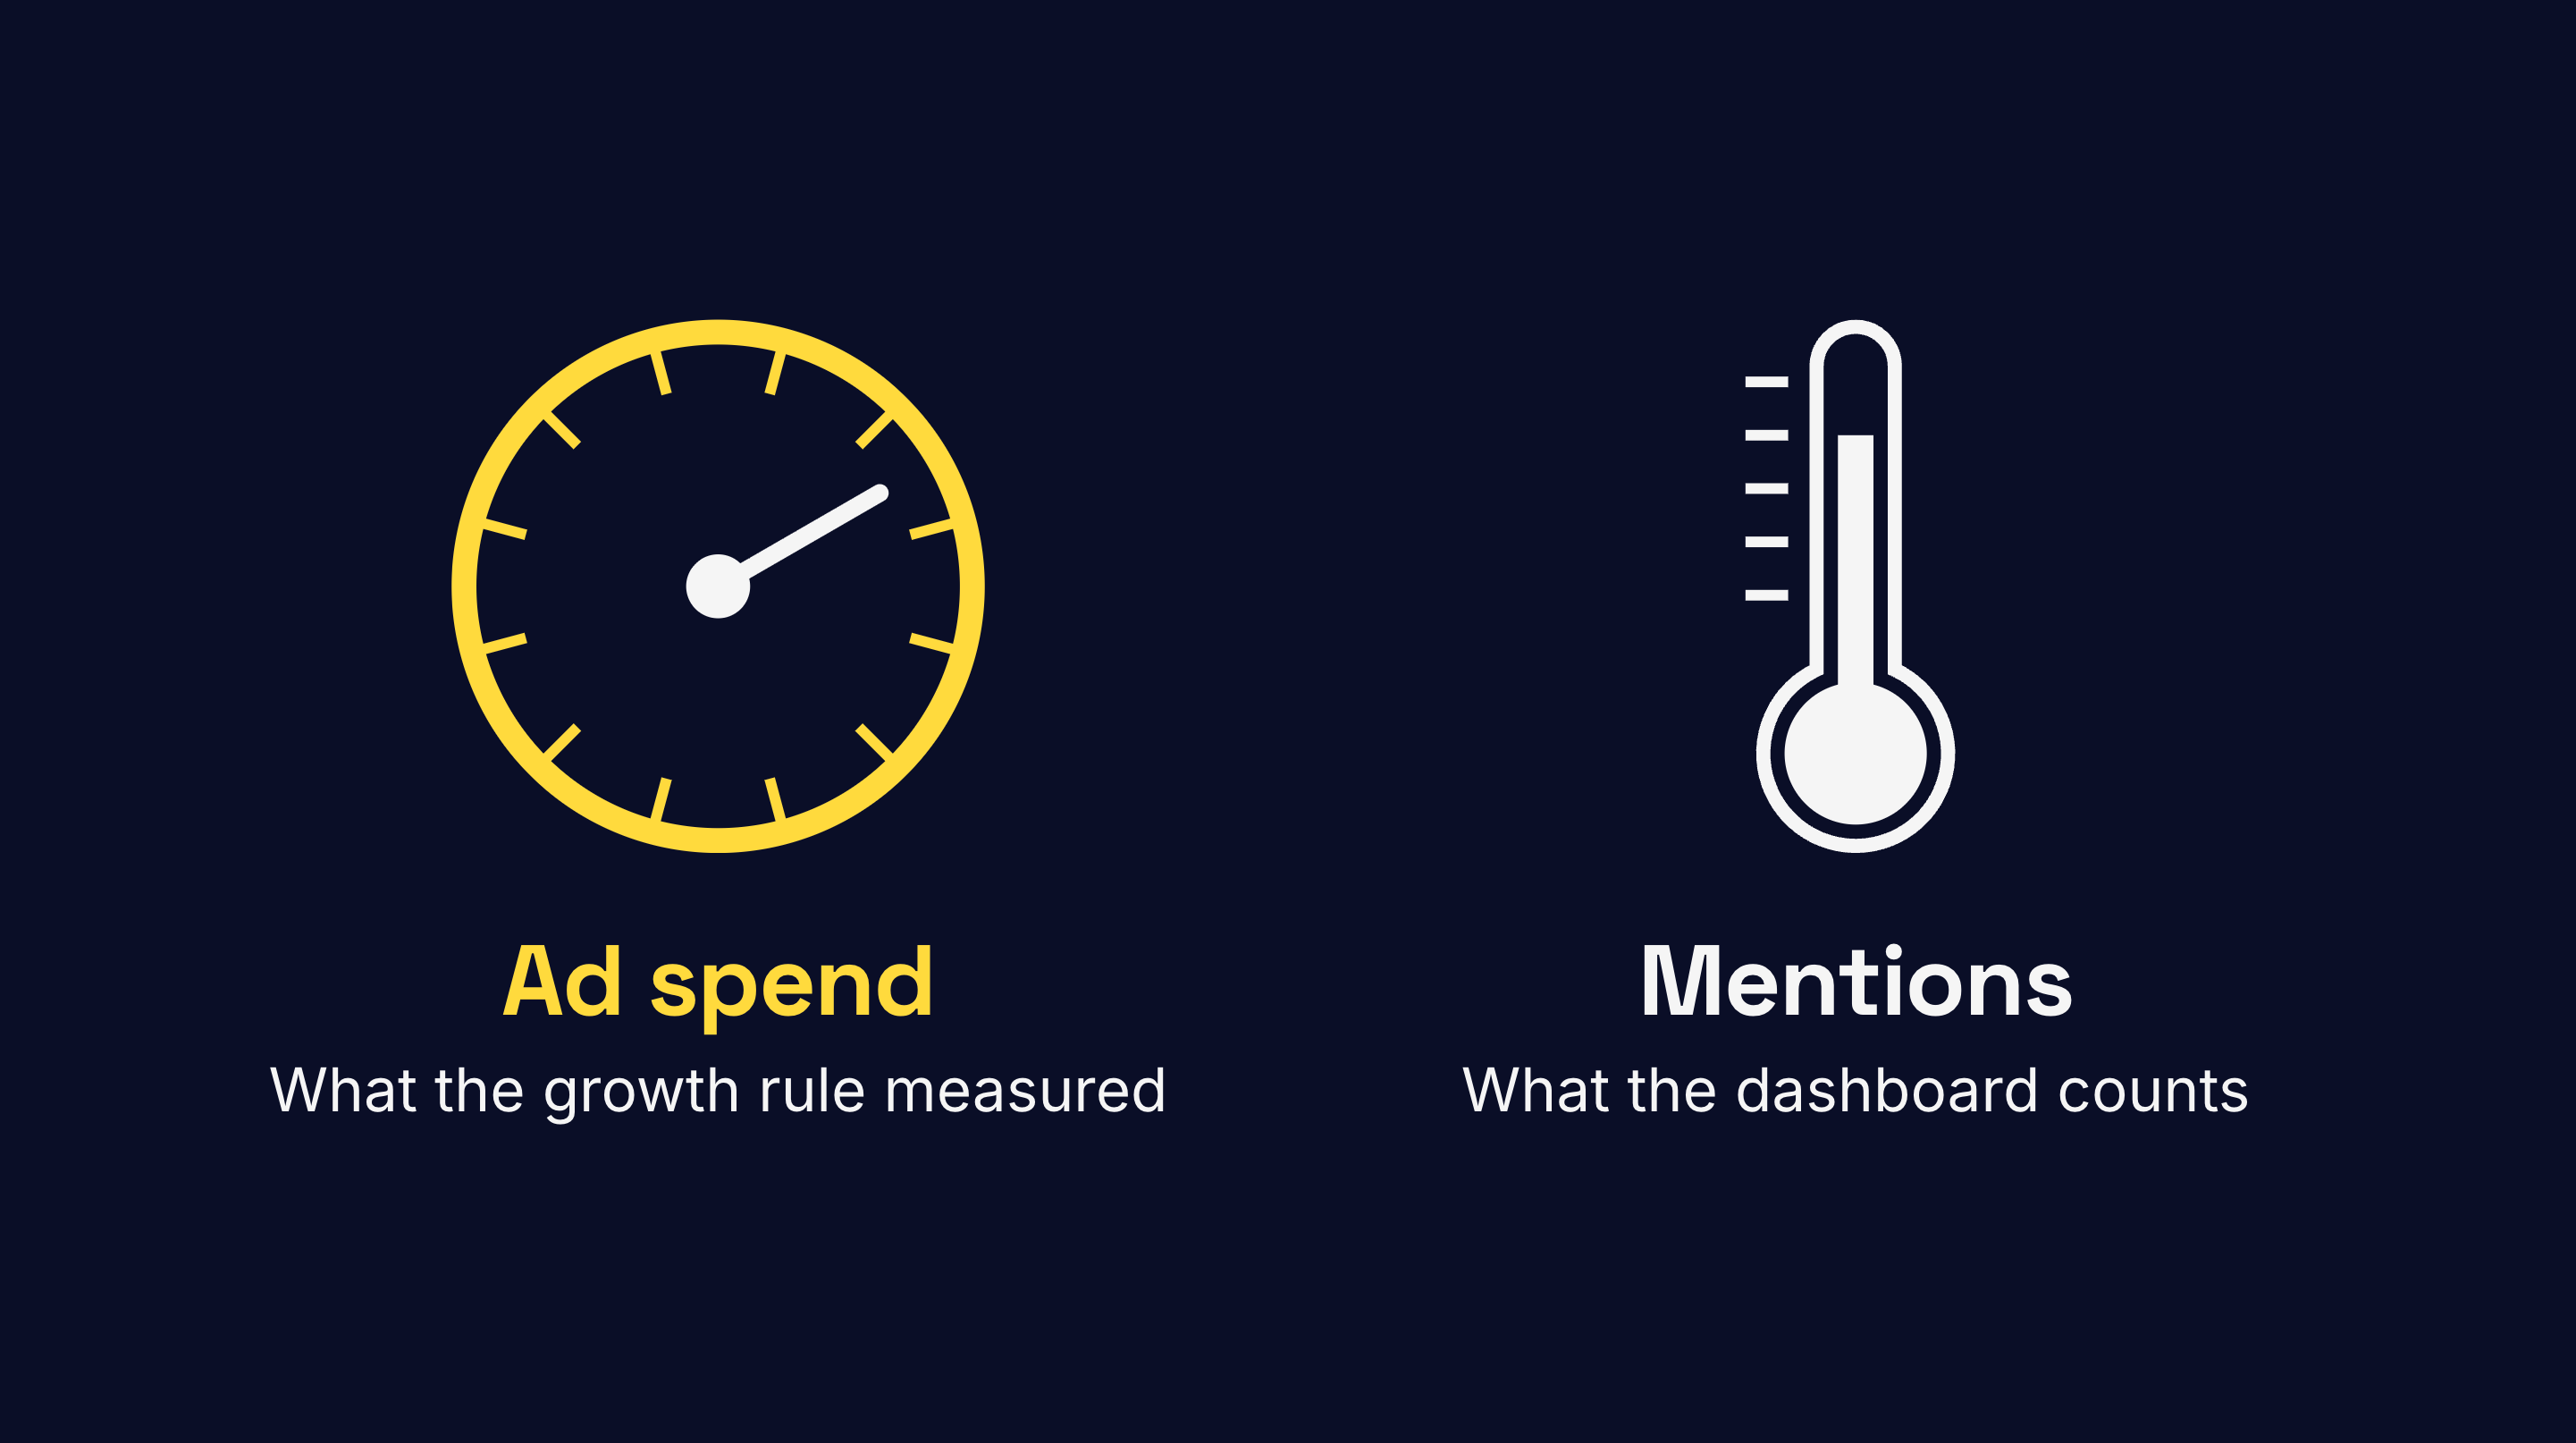
The rule is real. It just measured something different from the number on your slide.
Even Cannes Lions had a B2B session this June billed as HSBC’s story of going from eighth to first in share of voice in 5 months. The session page doesn’t say what was counted. That is the whole question: what the rule actually measured, and what your dashboard measures instead.
The rule was always about money
The studies behind the rule all measured the same thing. Advertising money.
Back in 1990, John Philip Jones wrote it up in the Harvard Business Review. HBR’s own summary defines share of voice as a brand’s share of the main media spending in its category. Your ad spend, as a slice of all the ad spend in your category.
The half-point number comes from a 2009 Nielsen study of 123 brands in 30 categories, running ordinary advertising, not award winners. Brands whose share of ad spend ran 10 points above their market share gained about half a point of extra share a year, on average. Nielsen offered it as a rule of thumb for consumer goods. Even then, it told brands to work out their own number rather than borrow the average.
The B2B version, from Les Binet and Peter Field for LinkedIn’s B2B Institute in 2019, defines it the same way: typically, your share of all the ad spend in your category.
So the rule describes a dial you control. Take a bigger slice of your category’s ad spend than your slice of the market, and your share tends to creep up, slowly and on average. It is a budgeting rule.
Somewhere along the way, money became mentions
Now look at how the tools you actually use define it.
Twelve companies that sell a share-of-voice number, or the ad space behind one, each publish a guide to what it means. They are social listening and media monitoring tools, SEO tools, HubSpot, and LinkedIn itself.
Read side by side on 23 September 2026, here is what they say. All 12 count mentions or online visibility as share of voice. 8 of them tie that number to market-share growth. 3 name the research behind the claim, and all 3 point to studies that measured ad spend. Not one cites a study that measured mentions.
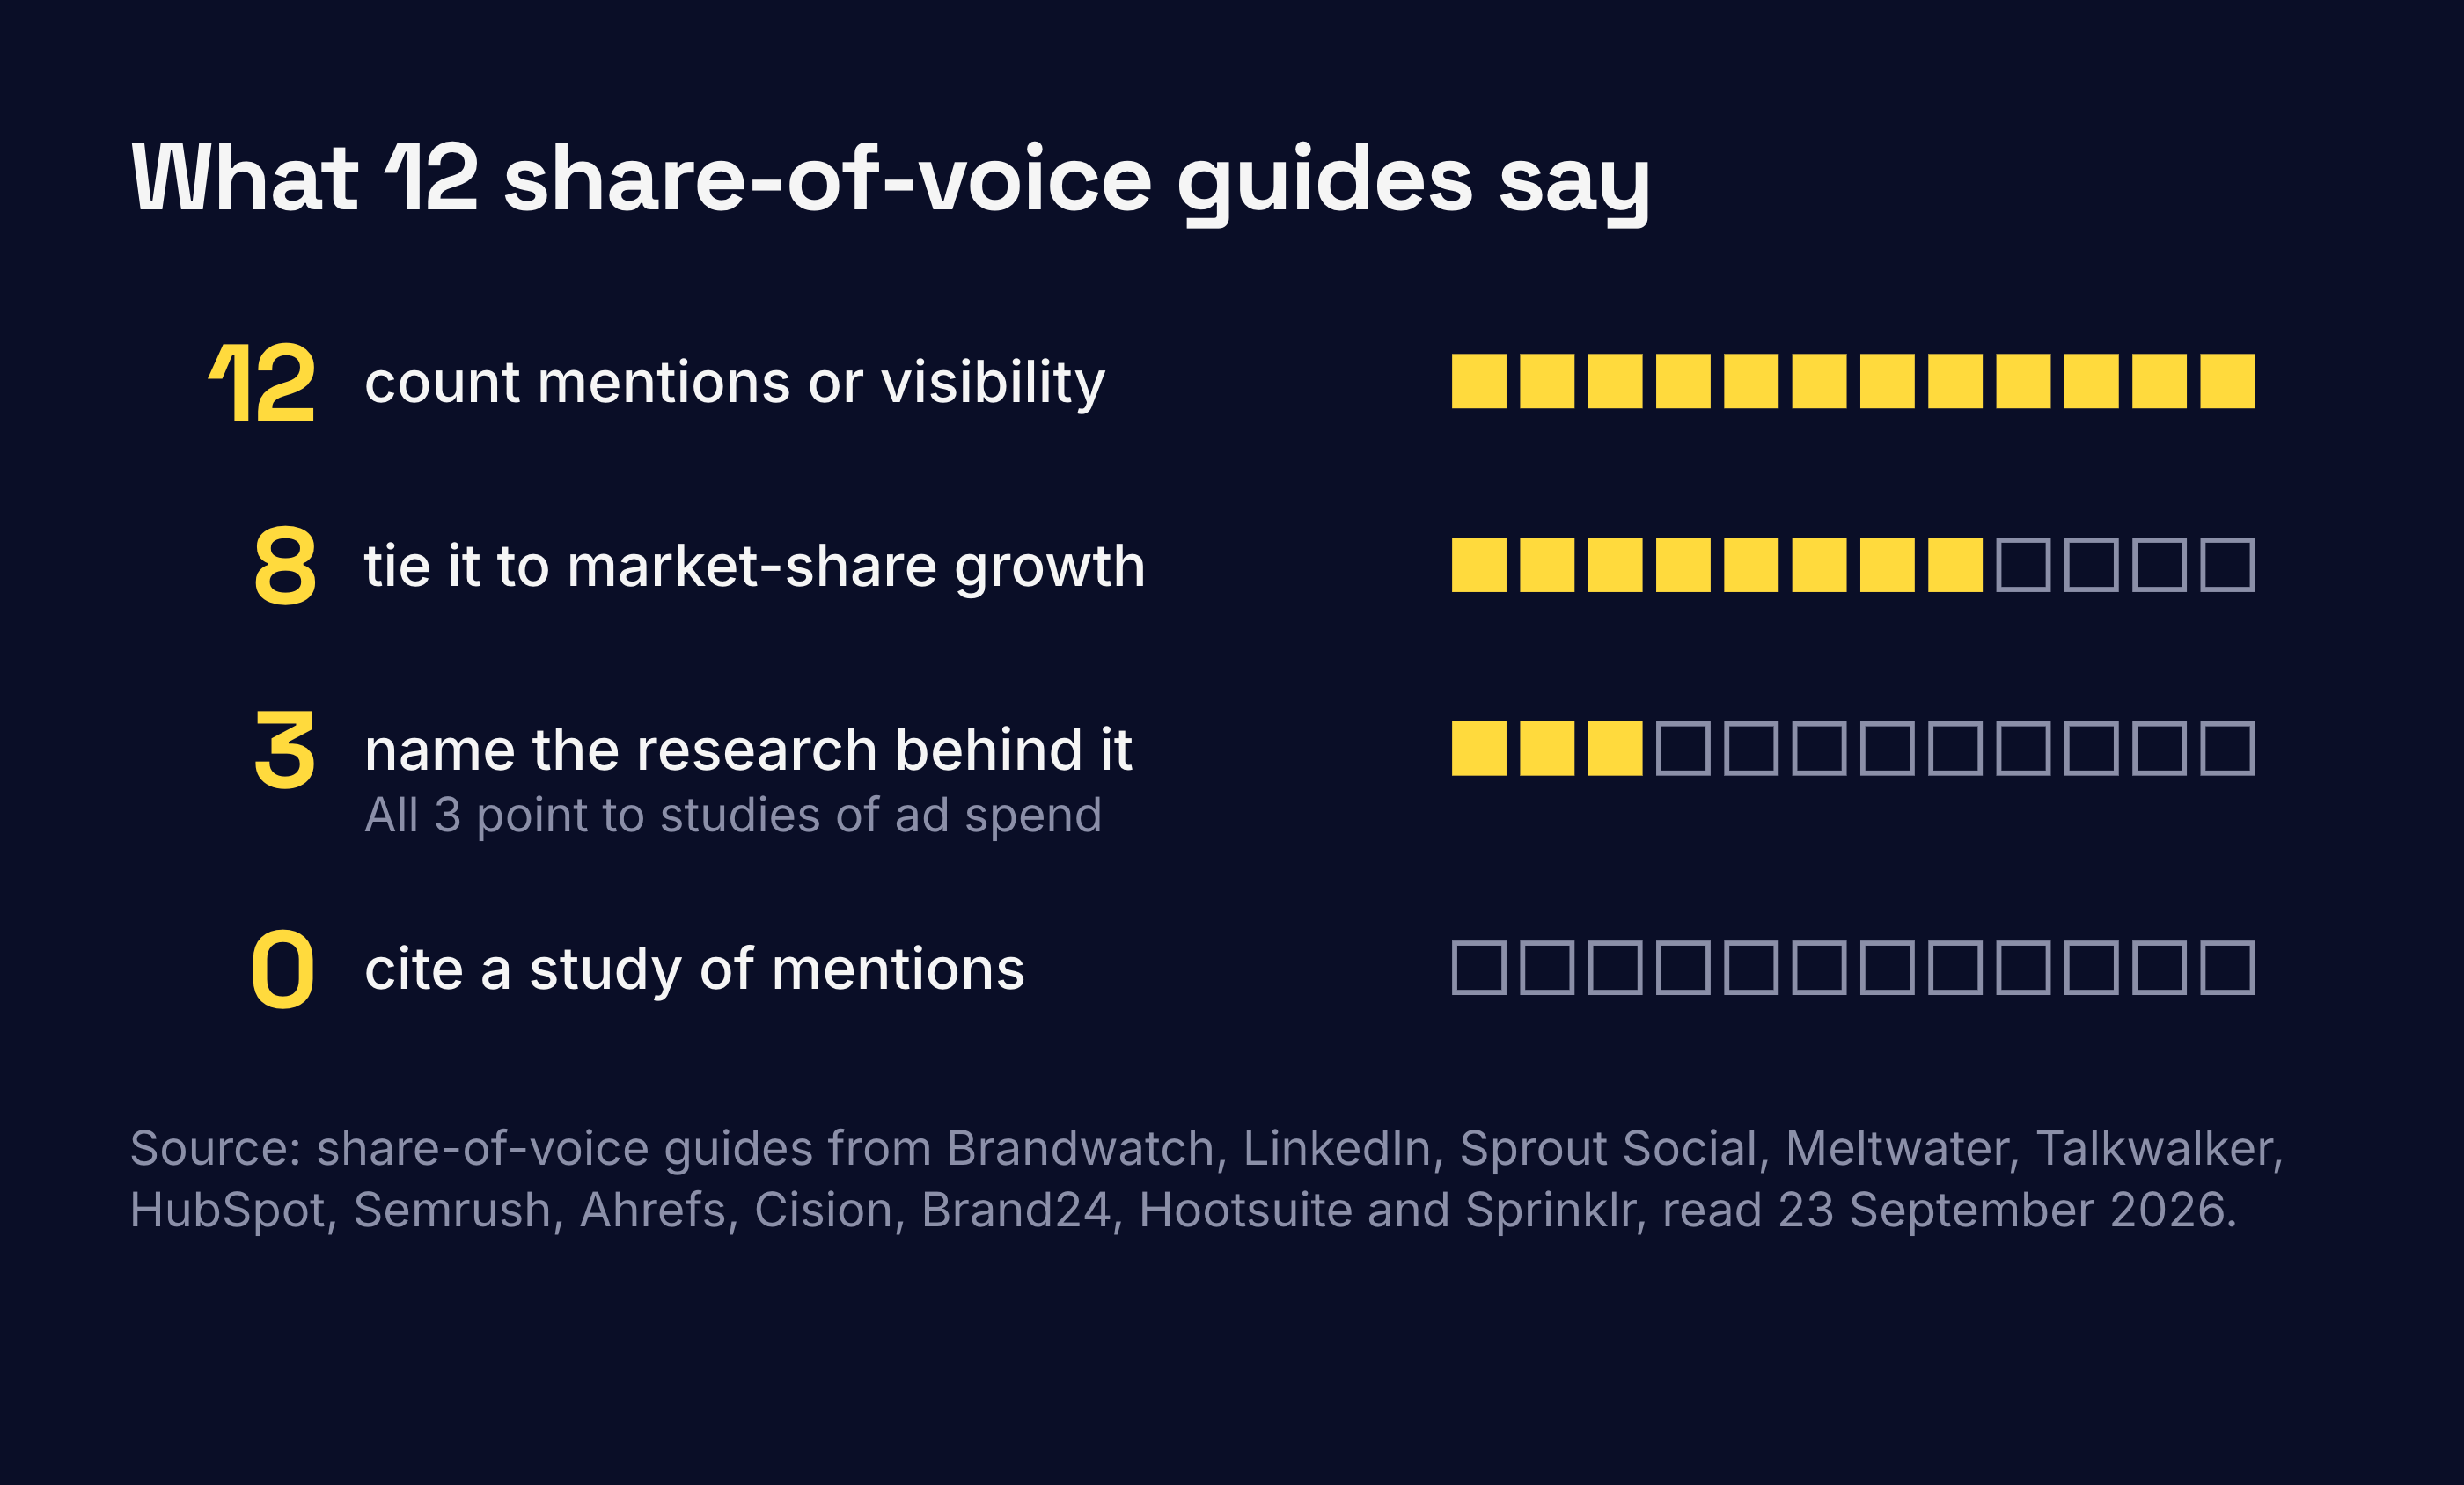
(The 12, if you want to check: Brandwatch, LinkedIn, Sprout Social, Meltwater, Talkwalker, HubSpot, Semrush, Ahrefs, Cision, Brand24, Hootsuite and Sprinklr. A chosen list, not a random one.)
Hootsuite at least says it out loud: share of voice used to measure paid advertising, and now it covers social mentions and where you show up in search.
LinkedIn’s marketing blog makes the same switch. It works an example from 200 mentions out of 2,000, then says numerous studies have “proven” the half-point rule. The report LinkedIn’s own think tank commissioned called its B2B finding “tentative”.
So the rule came along for the ride. The unit got left behind.
A 2021 report for the Advertising Council Australia, by Robert Brittain, Peter Field and Karen Nelson-Field, puts it neatly. Share of search, it says, is a thermometer. Share of voice is the thermostat. They were talking about search. My reading is that mentions work the same way. A mention count tells you how warm the room is. It can’t turn up the heat. It also can’t tell applause from complaints, which is how a relaunch full of negative comments turns into a 65% share of voice.
The B2B evidence is thinner than you think
Even in its own unit, the B2B case is thin.
The 2019 report drew on fewer than 50 IPA Effectiveness Awards cases from 1998 to 2018. That means campaigns good enough to be entered for awards, mostly from the UK and with relatively big budgets. The authors said so themselves and called their findings tentative. The B2B number came out at 0.7 points of share a year for every 10 points of excess, against 0.6 for consumer brands.
The same report shows how much an average like that hides. In consumer categories, the payoff ran from 0.2 in retail to 1.8 in other services, on cases from 1998 to 2008. That is a 9x spread sitting behind the one number on your slide.
If anyone has repeated the test for B2B since, it didn’t turn up in the research for this piece. The institute’s bigger 2021 study scored 435 B2B campaigns on budget, how long they ran and how many channels they used. Share of voice doesn’t come up once.
If you’re the challenger, read this twice
Here is what the vendor guides leave out. Researchers at the Ehrenberg-Bass Institute, summarising the evidence in 2021, note that bigger brands tend to spend below their market share and still hold it. Smaller brands spend above it just to keep their place.
Nielsen’s 2009 study points the same way. Leaders got 1.4 points of share for every 10 points of excess share of voice. Challengers got 0.4.
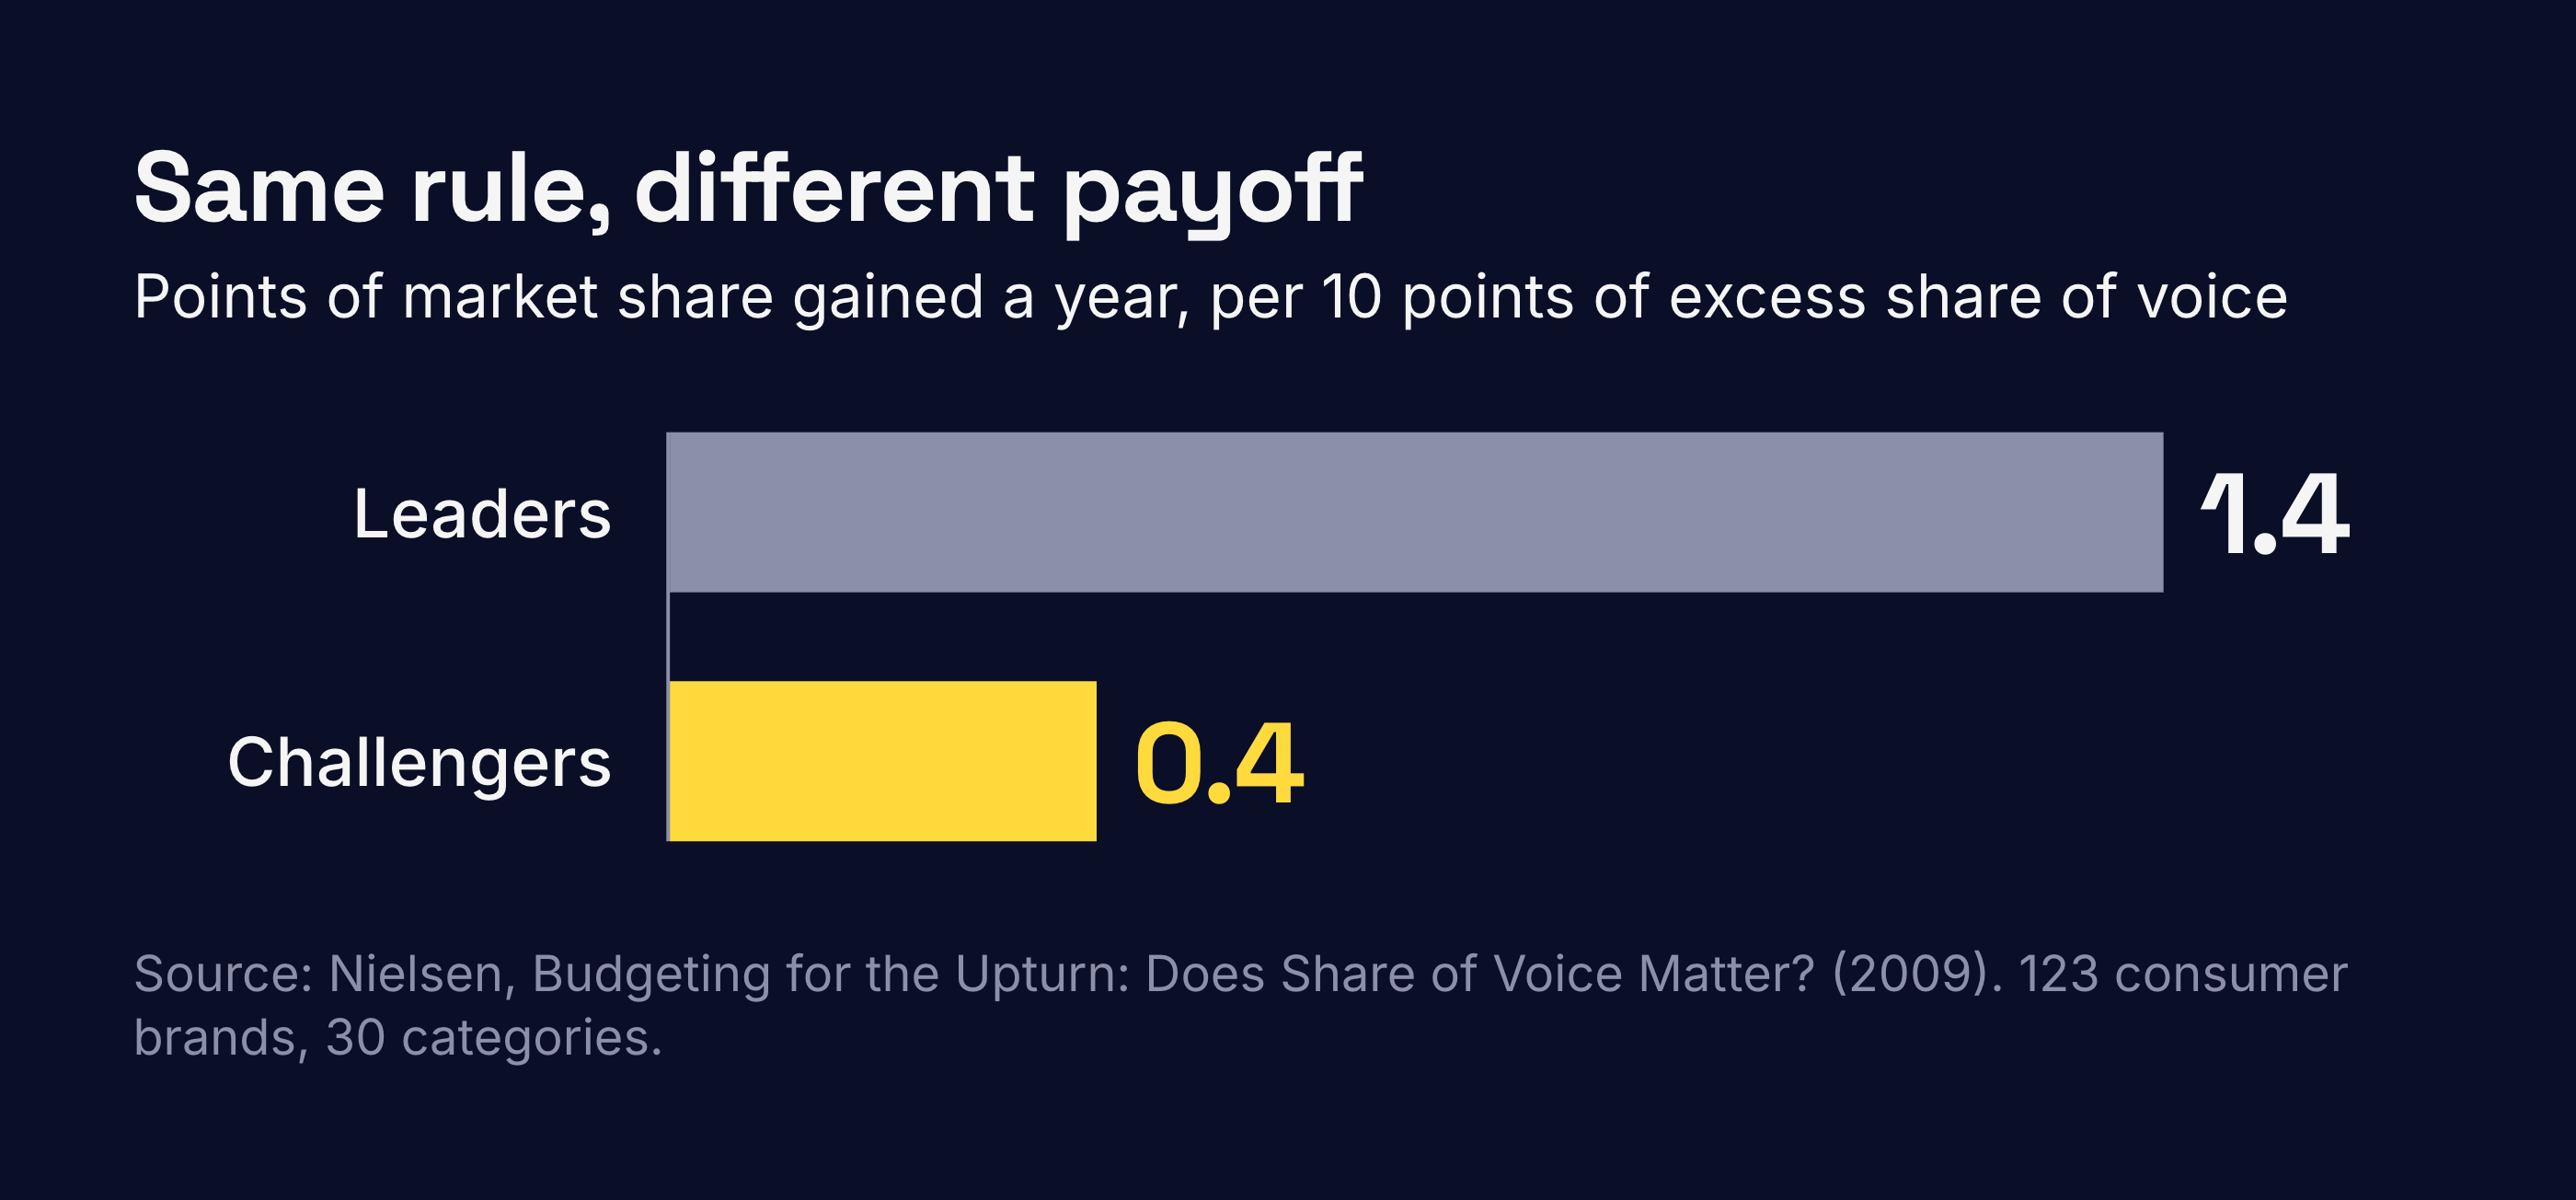
Both findings come from consumer categories, so treat them as a warning rather than a law. But if you work for the challenger in your category, spending above your share may just be what it costs to stand still. In Nielsen’s data, each point bought a challenger less than a third of what it bought a leader.
What I’m not saying
Mentions can matter. A 2012 study in the Journal of Marketing Research followed a microlending marketplace for 14 months and found that press coverage and social posts both moved sales. That is real evidence that attention can pay. It just isn’t evidence for the half-point rule, and nothing in the research for this piece tests that rule on mentions.
The rule has serious critics too. In 2016, Ehrenberg-Bass researchers reinvestigated ad spend against brand size across 11 countries and questioned how useful rules like this are for setting budgets. Binet and Field’s data still show the relationship in the unit they measured. Both can be true. Neither rescues a mention count.
What I’d put in the plan instead
Before share of voice goes anywhere near a budget line, write down which one you mean. There are really only three.
The first is your share of the category’s ad spend, measured against a market share you can actually source. This is the one the rule was built on, and it applies, tentatively, in B2B. Fair warning: it is getting harder to measure, with so much spend now inside digital walled gardens where it is hard to track. And if you can’t say where your market share number comes from, you don’t have an excess share of voice. You have a formula wrapped around a guess.
Then there is share of search, your brand’s share of the searches in your category. It is the only other version with published evidence behind it, from 30 cases across 12 categories and 7 countries, and even its champions call it correlation. If there is a B2B test, it is well hidden.
And then mentions, and now AI citations. Put them in the plan as visibility. Report them, and enjoy it when they go up. Just don’t attach the half-point to them. One of the 12 guides already puts AI share of voice right next to the growth claim. I went through what Google and Microsoft actually publish about AI search a couple of weeks ago, including what Google thinks of chasing mentions. So I will leave the tactics there.
How much to spend overall is a different fight. Last month I went through why the budget benchmark you can find in 90 seconds is not your number.
If you are planning a share-of-voice line in your budget, the best place to start is one question. What does the share-of-voice number in your last board deck actually count: ad spend, impressions, mentions or AI citations? Answers in the comments, please.
If this was useful, subscribe. The weekly issue stays free.
Every figure above comes from the source linked beside it. The 12 vendor guides were read on 23 September 2026 and can change without notice; the studies carry their own years, printed where they appear.
Monday GTM is a weekly read on how B2B go-to-market actually works, for the people doing the work. No theory, no fluff. Just what holds up when you look closely.
I write Monday GTM alongside my work at Loop & Ladder, a growth consultancy.