

As we enter the second half of the year, I was reminded of the dreaded yearly ritual of budget allocation. Now I have sat on both sides of this - inside a bank and telco, belligerently defending a number I built on an excel sheet, and outside as a consultant watching client leadership build one, hoping and praying that my retainer makes the cut. The ritual is the same across the board; a senior will ask you what the number should be and everyone starts scrambling for benchmarks to justify their asks.
The number you will find in 90 seconds
During your budget discussion, a senior is going to ask you what share of the revenue should marketing get next year. And it will take about 90 seconds for you to find the answer. Let me make it easier for you.
Two surveys dominate every result. Gartner’s 2026 CMO Spend Survey puts marketing at 7.8% of company revenue, up slightly from 7.7% the year before. The CMO Survey, run by Duke’s Fuqua School of Business with Deloitte and the American Marketing Association, puts it at 9.0%.
That looks like a disagreement. It’s really not.
Gartner surveyed 401 CMOs across North America, the UK and Europe between January and March 2026, and the vast majority run companies above $1bn in revenue. The CMO Survey polled 308 US marketing leaders in January 2026 across every size band, with roughly a third of respondents under $100M in revenue. Smaller companies spend a higher share of revenue on marketing. Two populations, two averages, nothing to reconcile.
Two things to watch while you are searching. A 9.4% figure still circulates widely as the current number; that is the spring 2025 reading. And marketing as a share of company revenue is not the same as marketing as a share of the total company budget, which sits at 9.6% and has fallen to its lowest level since 2021. The two get swapped freely.
So you pick one. Most people would be tempted to pick 9.0%, because it comes from a free academic survey that publishes its methodology, and because it is the more generous of the two.
That is where the trouble starts.
The same report already has your number in it
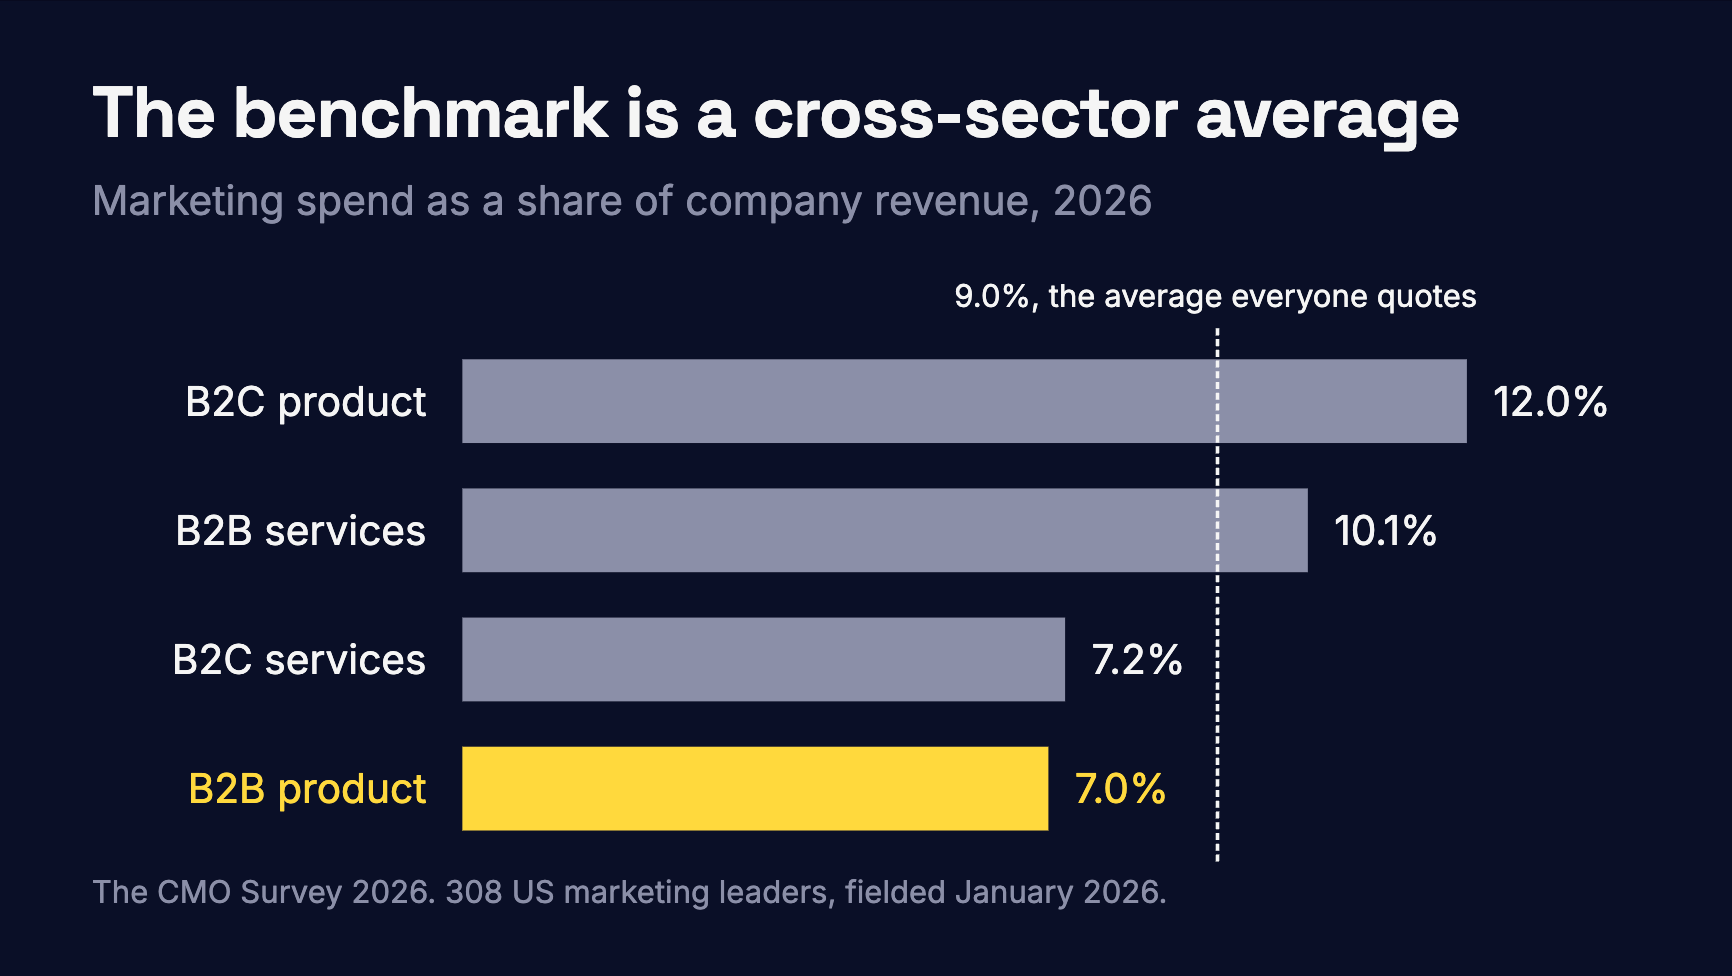
The CMO Survey does not report one figure. It splits its results into four economic sectors, and the split is on a single slide that almost nobody quotes.
SectorMarketing as % of revenueB2C product12.0%B2B services10.1%B2C services7.2%B2B product7.0%
If you sell a B2B product, your peer figure is 7.0%. Not 9.0%. The average you were about to plan against is being pulled upward by consumer product companies spending nearly twice what your sector spends, and the gap is not a rounding difference. On $50M of revenue it is the difference between a $3.5M budget and a $4.5M one.
Keep reading the same report and the picture gets sharper, because the sector cuts run through every question.
Over the prior 12 months, overall marketing spending at B2B product companies changed by −0.2%. It did not grow slowly. It shrank. B2B services grew 2.8%. B2C services grew 8.0%.
Marketing organisations at B2B product companies grew 0.0% over the same period. Not slowly. They did not grow at all for the surveyed orgs. B2B services added 3.9%, B2C services 4.6%.
When profits are lower than expected, and executives decide to trim the fat, marketing is the thing they cut 49.9% of the time at B2B product companies, the highest rate of any sector. At B2C services it is 28.8%.
And underneath that sit the softer readings, which point the same way. B2B product companies rate the importance of their marketing capabilities at 5.6 on a 7 point scale, the lowest of the four sectors. They rate digital marketing’s contribution to company performance at 4.83, also the lowest. They rate the CFO as a business partner in building the case for marketing spend at 4.3, against 4.9 for B2C services.
Each of those numbers sits on its own slide but once read in sequence, they describe a sector that spends less, grew not at all, gets cut first, and has the weakest finance relationship of anyone in the survey.
There is one reading that cuts against this, and it matters. B2B product marketing leaders are the most likely of any sector to be asked into board meetings, at 5.5 on the same scale, and into earnings calls at 5.3. Both are the highest of the four groups.
So the importance is real. B2B product marketers are in the room. They just don’t get funded.
Half of these companies spend 5%
There is a second document, and it changes the shape of the whole exercise.
The CMO Survey publishes a Highlights report and a Topline report. The Highlights report is the one that gets read, screenshotted and quoted, and it reports the mean. The Topline report gives the full distribution for every question, and hardly anyone opens it.
So me, your friendly neighbourhood GTM person, went through the reports to make your job easy.
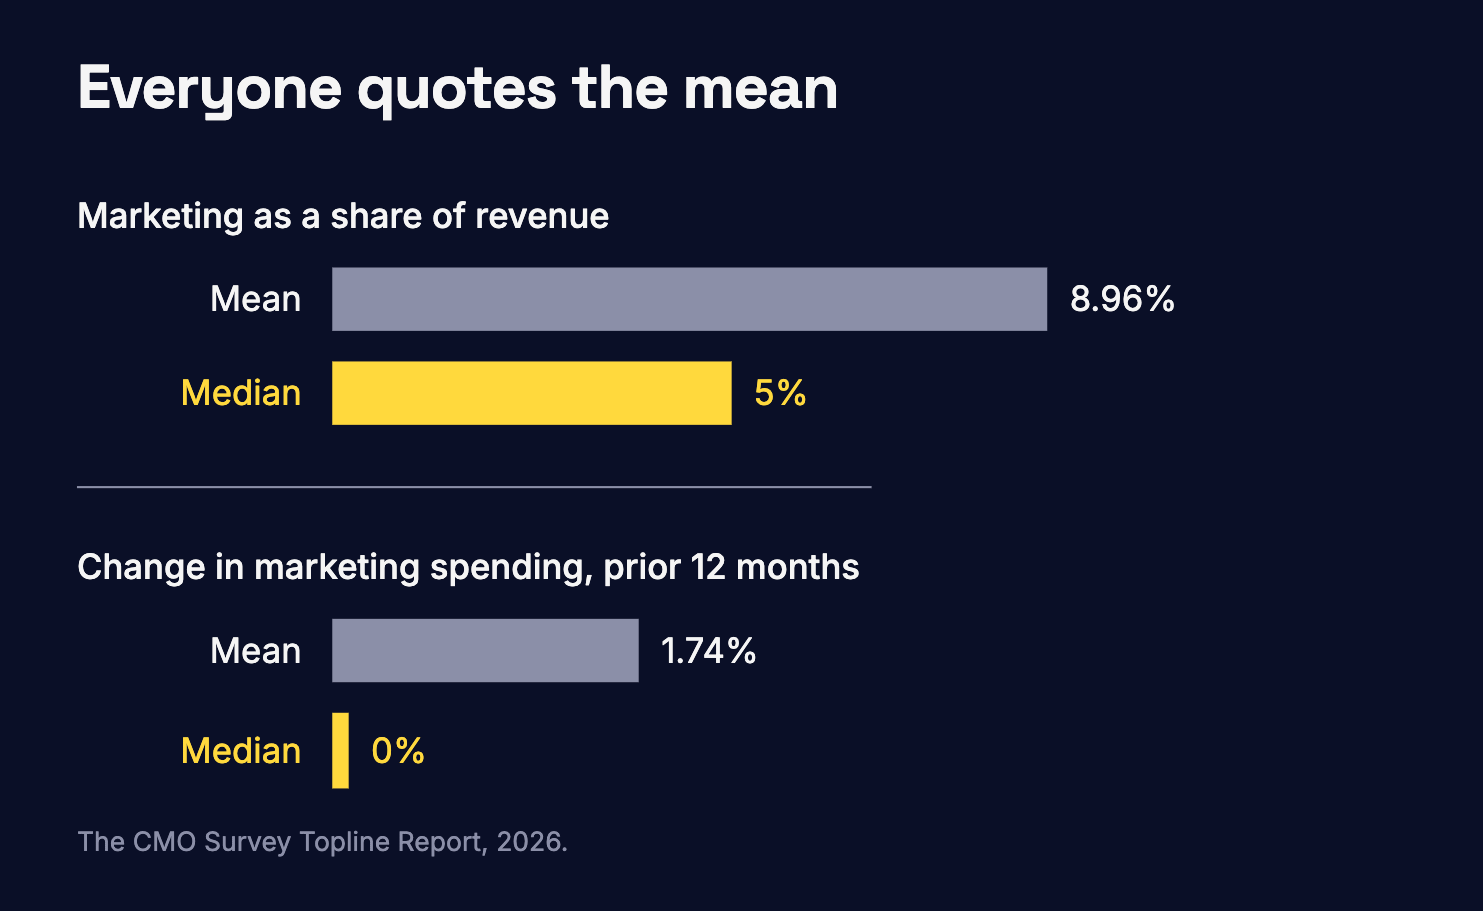
Marketing as a percent of company revenues: mean 8.96%, median 5%.
Overall marketing spending change over the prior 12 months: mean 1.74%, median 0%.
Read the second pair again. Half the companies in this survey did not move their marketing budget last year. Not up, not down. Flat. Zero. The 1.7% growth figure that gets reported as the headline is produced by a minority of companies making real increases while the middle of the market stood still.
And on the revenue share, half of these companies are at 5% or below, against an average of 9.0%. The distribution is not a bell curve with a fat middle. It is a long tail of heavy spenders dragging an average away from where most companies actually sit.
This is not a flaw in the survey. It publishes both figures. It is a choice about which one to lead with, and the same report uses the median elsewhere, reporting that the median duration of marketing’s effect on customers is 6 months. So the median is there when it matters. It just never gets applied to the number everybody quotes.
Where the money actually goes
Knowing how much to spend is half a budget. The other half is what it gets spent on, and here Gartner is the better source, because it publishes the split.
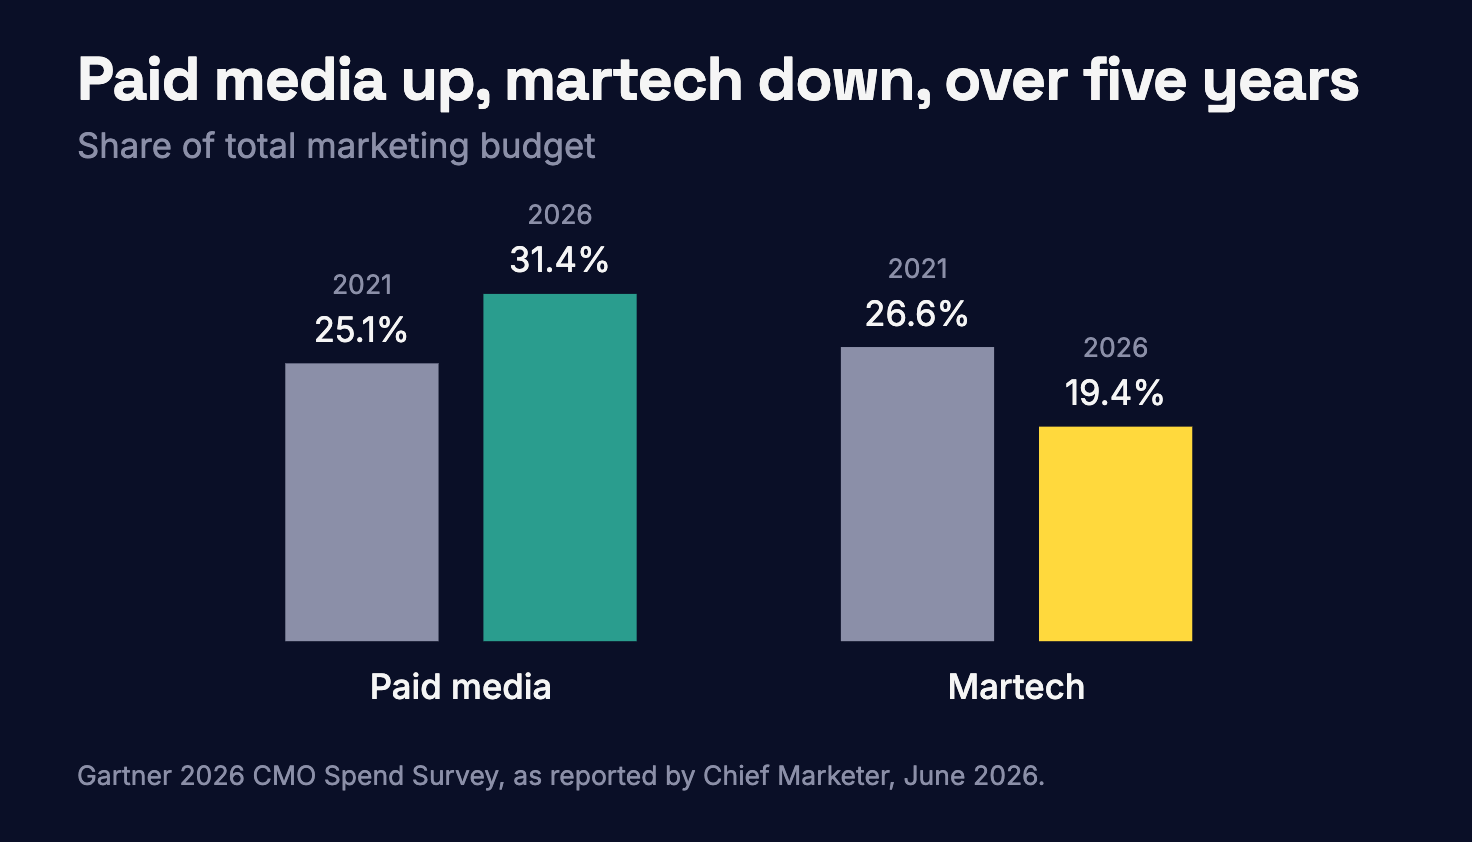
Gartner divides the marketing budget four ways. Paid media takes 31.4%, labour 24.5%, martech 19.4%, and agencies the remainder. Those figures come from Gartner’s 2026 survey as reported by Chief Marketer in June 2026.
The direction matters more than the levels. Paid media is at a five-year high, up from 25.1% in 2021. Martech is at a five-year low, down from 26.6% over the same period, and that is happening while 62% of CMOs say they plan to invest more in martech. Labour has risen from 21.9% to 24.5% over the past year, while 43% say they expect to reduce labour spending. Both are worth sitting with, because in each case the stated intention and the actual allocation point in opposite directions.
Digital now takes 67.5% of marketing expenses, up from 54.9% in 2023. Within digital, search advertising takes 16%, social advertising 15.7% and SEO 9.4%.
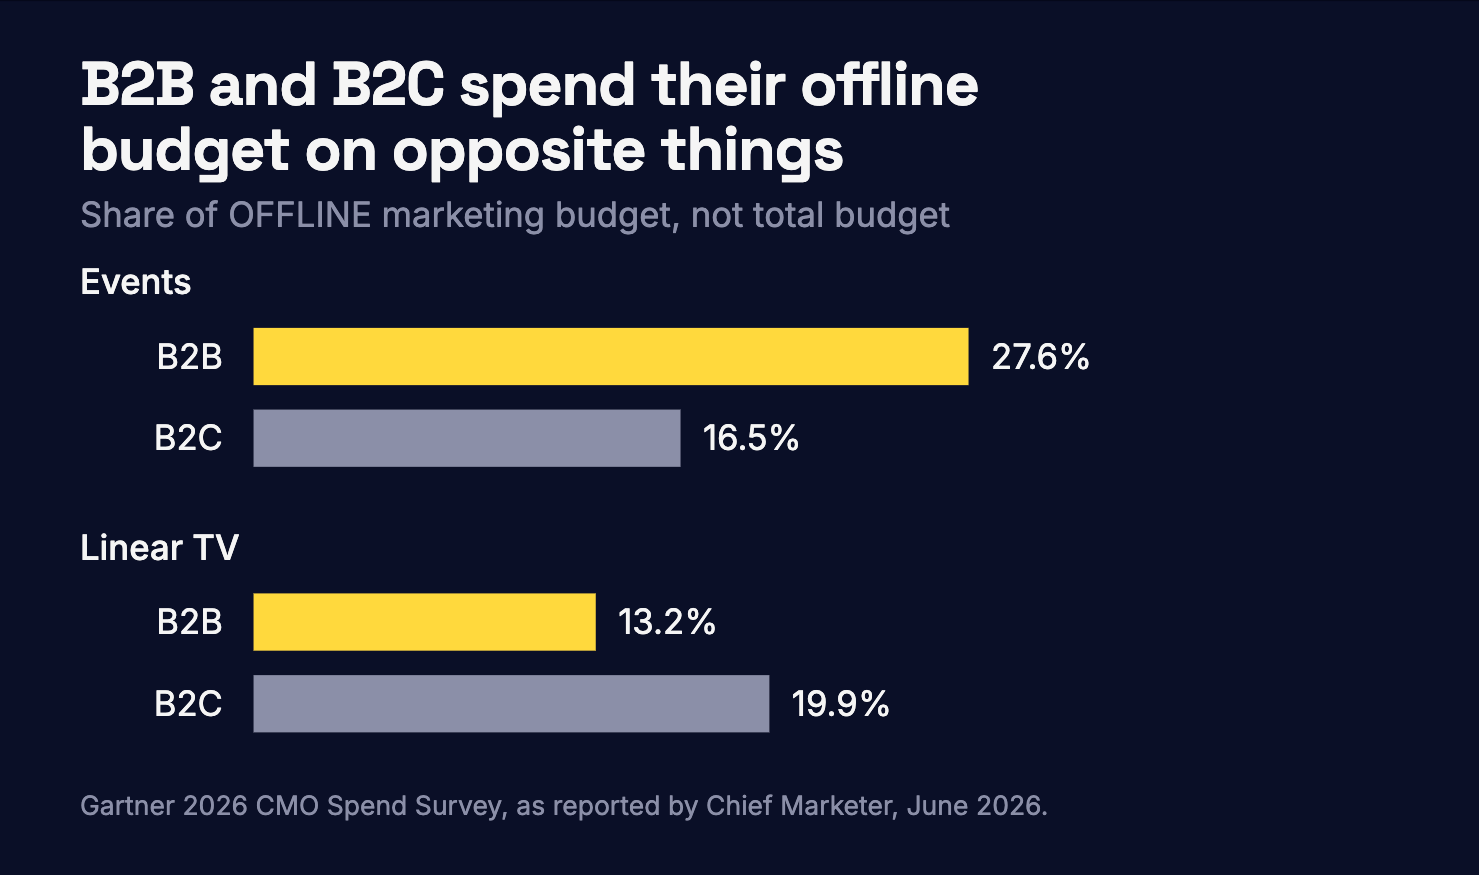
The offline half is where B2B looks least like everyone else. Across all respondents, event marketing takes 23.1% of offline budget, up from 19.4% the year before, followed by sponsorships at 18.2% and linear TV at 15.5%. Split by sector, B2B CMOs put 27.6% of their offline budget into events against 16.5% for B2C, and 13.2% into linear TV against 19.9% for B2C. If you are defending an events line this year, that is the number to defend it with.
One more worth planning around: 56% of organisations increased their allocation to consumption-based martech pricing, and half of those that adopted it are continually renegotiating contracts to avoid usage and cost spikes. If you are moving to usage-based tooling next year, the renegotiation is not an exception. It is the operating model.
A caveat that follows from everything above. This is the Gartner population, which means companies above $1bn across North America, the UK and Europe. Treat the split as shape rather than prescription. The direction of travel holds better than the actual numbers do.
The plan is not the budget
One last thing, and it reframes what you are actually doing this month.
Goal attainment across the Gartner sample fell on every measure year on year. Only 49% of CMOs exceeded their brand awareness goals, against 57% a year earlier. Only 46% exceeded campaign impact objectives, against 58%. Only 43% exceeded ROI objectives, against 56%. The share falling short of acquisition goals rose to 20%, from 13%.
And 62% said that an inability to meet 2026 growth expectations would result in marketing budget cuts.
Meanwhile, 20% of teams already reallocate more than 5% of their budget across channels every month. Another 38% do it quarterly, and 14% do it continuously.
So the number you write down in November is not the number you will run. It is an opening position that will be revised within a quarter, and cut outright if the first miss arrives. Which means the plan’s real job is not to be accurate. It is to decide, in advance and in writing, what survives the first miss and what does not.
The benchmark cannot tell you that. Your sector’s actual position can get you closer.
I hope you now have all the arrows in your quiver to respond to the senior when they ask you what share of revenue should marketing really get. You now have your sector’s actual figure, the information that half the market sits at 5% or below, and the channel split to answer where the budget is being allocated to. The takeaway for the stakeholders in the room should be that discussing these benchmarks is not worth more than 10 minutes; the real decision is what to hold on to when the return is not as expected.
If this was useful, subscribe. Free, every Monday.
One question, and I would like an actual answer in the comments: what percentage is in your 2027 plan right now, and which of the four sectors did it come from?
Figures in this piece come from The CMO Survey 2026 (35th edition, 308 US respondents, fielded 7 to 29 January 2026) and the Gartner 2026 CMO Spend Survey (401 CMOs, North America, UK and Europe, fielded January to March 2026). Gartner’s budget mix figures are drawn from Chief Marketer’s June 2026 reporting, as Gartner’s own summary page no longer carries them. All sources checked on 9 August 2026.
Monday GTM is a weekly read on how B2B go-to-market actually works, for the people doing the work. No theory, no fluff. Just what holds up when you look closely.