

A week ago I told you that your acquisition engine was filling a bucket with a large hole in it. I also doubled down with this and said that churn was a GTM problem and you had sold it to yourself.
Well, I was wrong about this and I need to come clean.
You see, I read the coverage of the 2026 benchmarks and not the actual benchmarks. I wanted to finish my article and schedule it and I needed to tease the next week’s topic. But this week I went and opened the actual reports side by side. The thing I promised you was the most boring finding. And I promise you the correction is a better story than the original.
The number that got your attention
Here is what set the year on fire. Benchmarkit’s 2026 benchmark report, drawn from 342 companies, found median gross revenue retention had fallen from 88% to 84% in a single year. Even the top quartile slipped, 95% down to 91%. They called it the most alarming data point in the whole study, and the industry agreed loudly for about six weeks.
Then you go and find other reports on this.
SaaS Capital surveyed over 1,000 private SaaS companies and put gross retention at 91%, essentially flat. But KeyBanc’s survey said it is recovering, down to 86% in 2023 and climbing back toward 90%. Datadog told its Q1 call that gross retention was sitting stable in the mid to high 90s. HubSpot’s customer dollar retention is in the high 80s and its net retention went up.
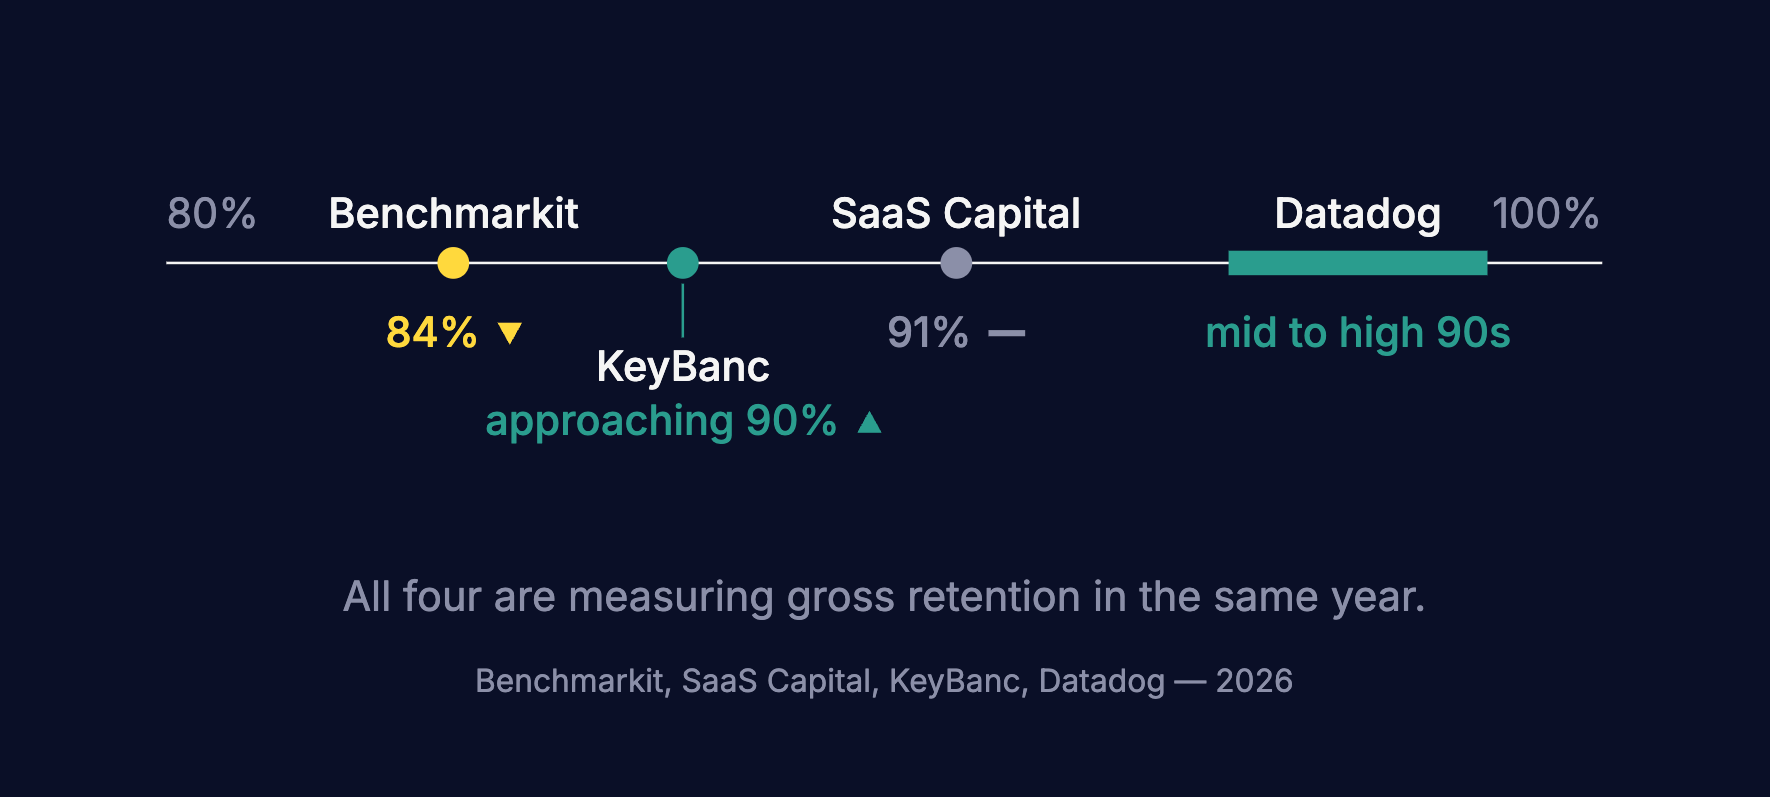
Four readings. Four directions. I spent a while trying to work out which one was right and then realised that I was just wasting my time.
Because the through-line stringing all these reports along is a finding no one argued about. It was present in every dataset and it was the one that should have been the headline.
The number you didn’t notice
The ceiling has come down.
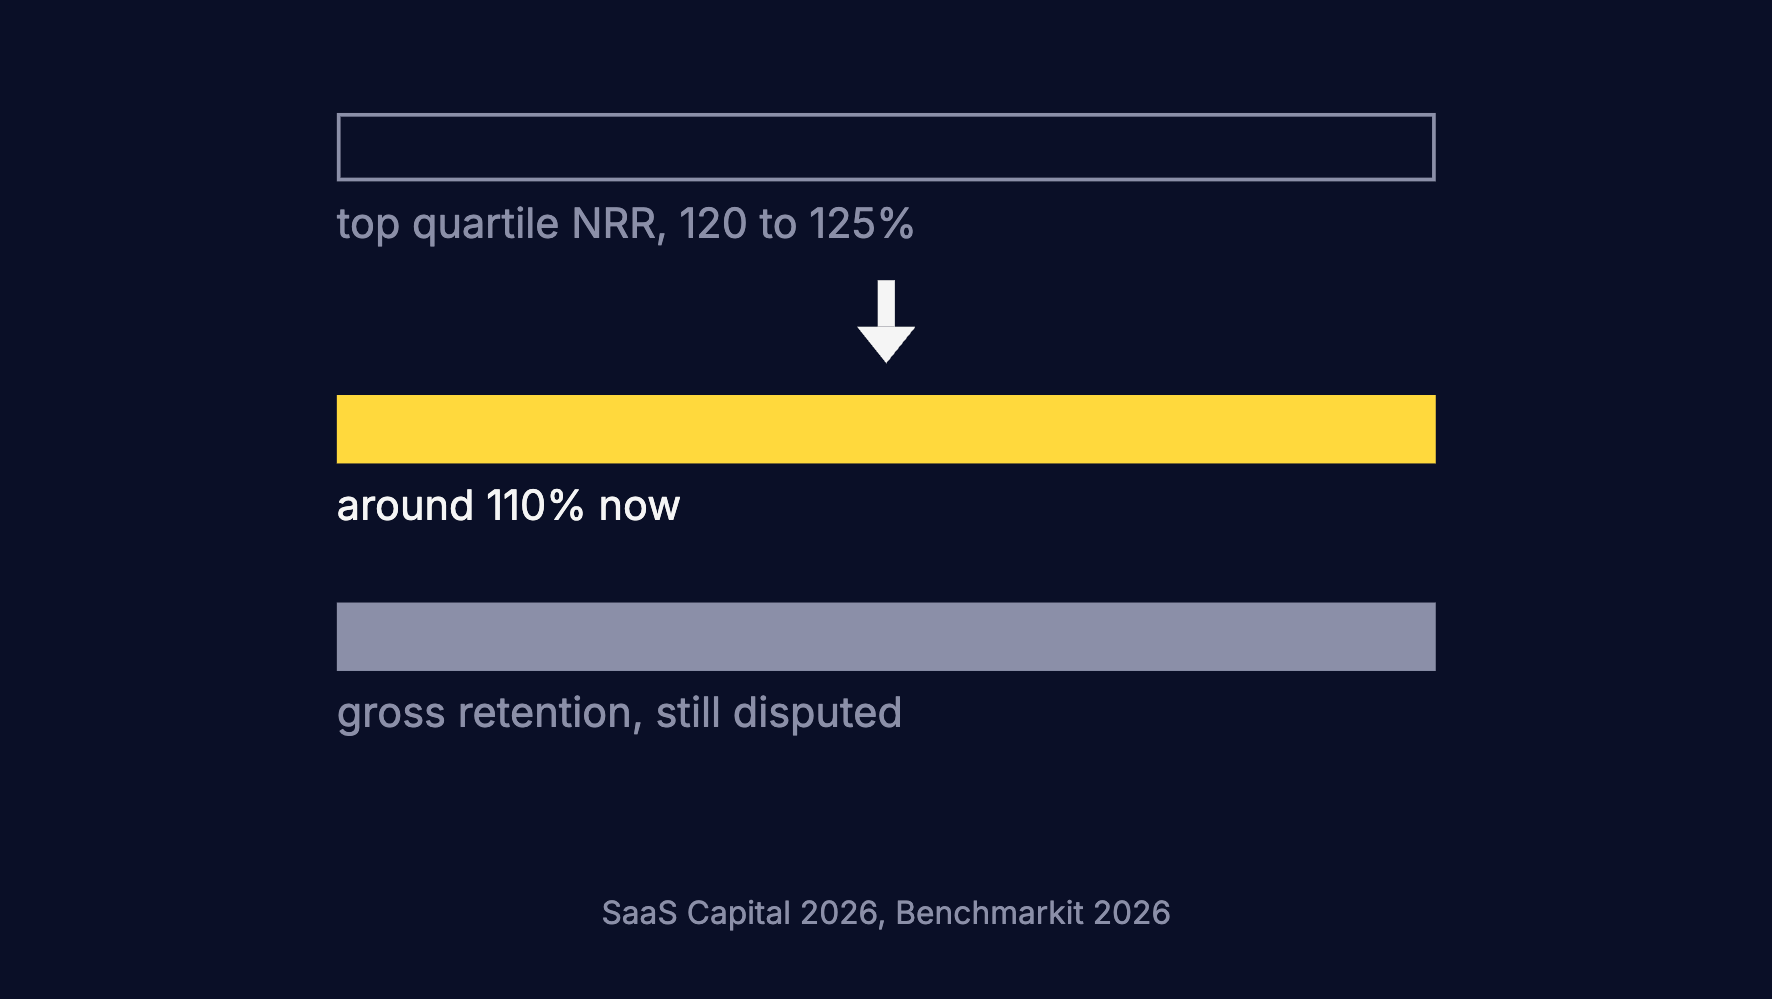
Top-quartile net revenue retention used to sit at 120 to 125%. Rob Belcher at SaaS Capital now puts it around 110%. Benchmarkit’s 75th percentile went from 110-111% down to 108%. Different samples, different methods, same direction, no dispute.
Belcher’s read on his own data is the most useful sentence published about retention this year. People are retaining their customers, he says. They just cannot upsell, cross-sell and raise prices the way they used to.
Let this sink in because this is the crux. Your customers are not leaving you. They just are not growing like before.
Which makes it very pertinent for us to ask this question - what exactly was making them grow before?
How did we build the “good ol’ days”
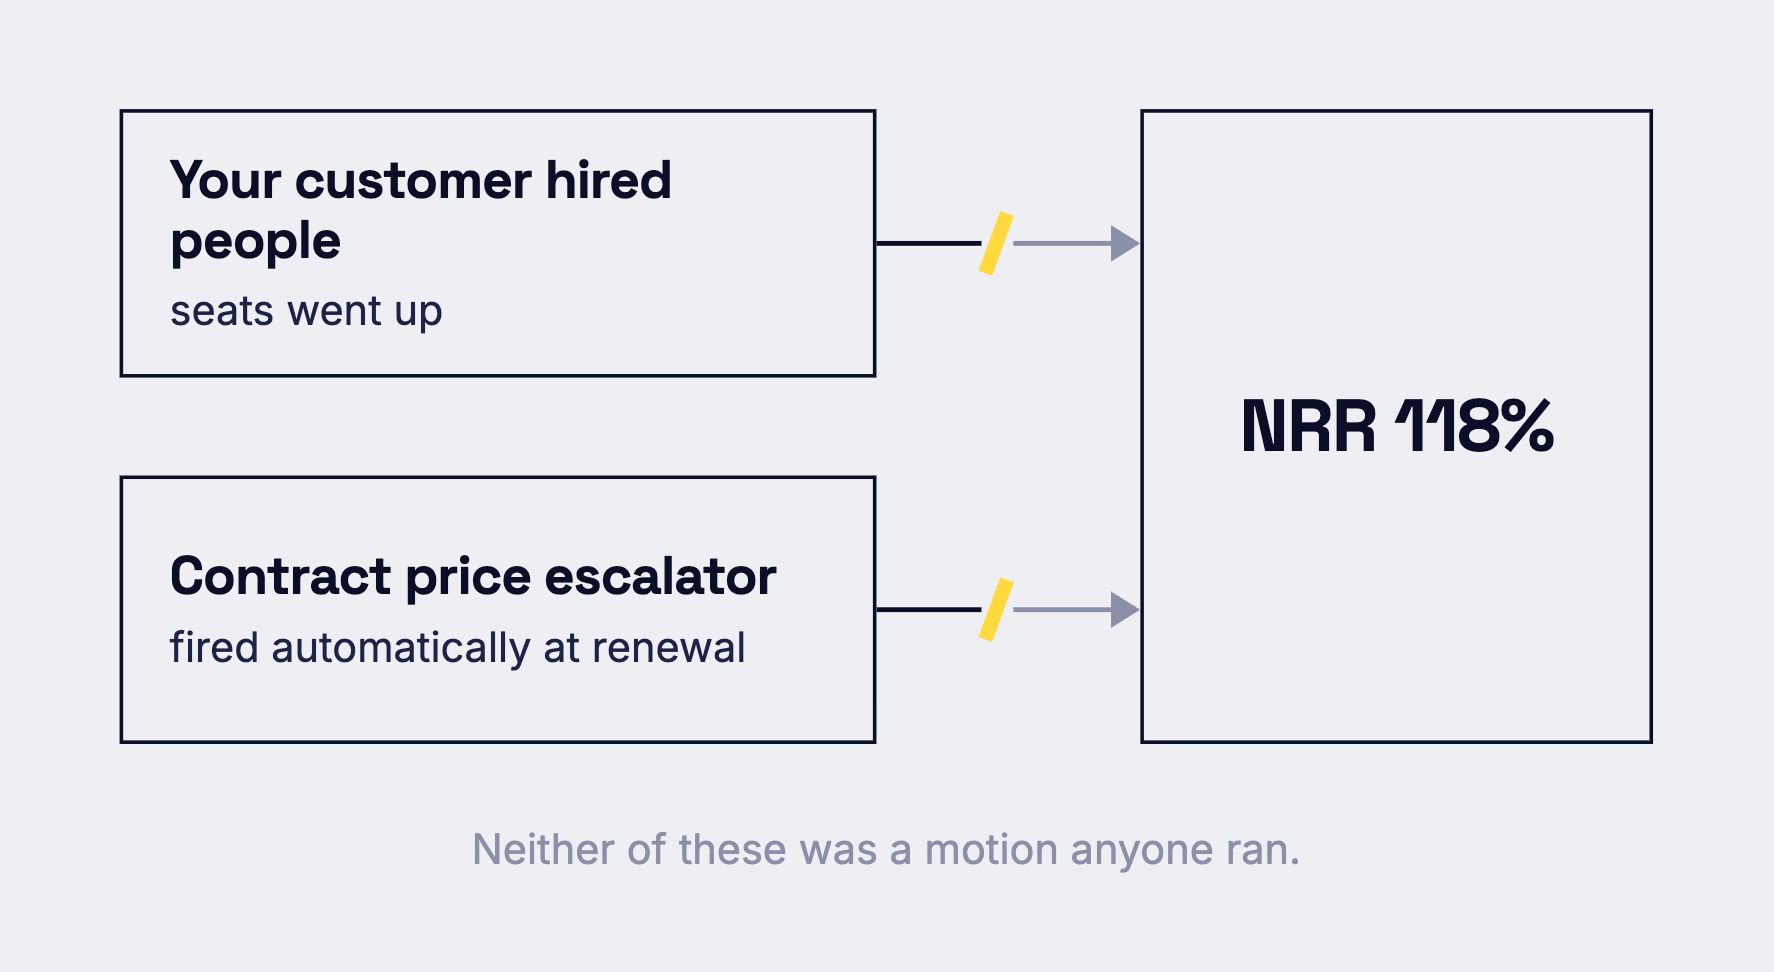
Let us go back to a typical renewal in 2021. Your customer hired 40 people that year, so the seat count increased. Their contract had a 4% increase built in which came into effect automatically on renewal. There was no negotiation. The account manager sent the invoice to someone in procurement, who signed it and your NRR went up to 118%. A great day in the office.
You put that number in your slide and the accolades kept coming.
Belcher did the math no one wanted to do. A 5% annual inflation adjustment, compounded, is roughly half of that NRR. Half. Not from a motion, not from a strategy play, from a clause somebody’s lawyer put in the paper years ago and everybody forgot about.
HubSpot said the same thing about itself, out loud, on its own Q4 earnings call. Customers coming up for renewal saw up to a 5% price increase, and management credited it directly with holding up net revenue retention. That is a public company telling its investors that part of its expansion story is a price rise on the existing base.
And the other half, the seats? Seat-only pricing now sits at 98% median NRR. Below 100. Below the line where the base sustains itself without you selling anything new. Usage-based sits at 108%, which sounds like a pricing lesson and mostly is one, though I got into why the unit matters more than the model a few weeks back and won’t regurgitate it here.
Look at Datadog if you want to see what a genuinely healthy 2026 expansion number looks like. Net retention in the low 120s, up from the high 110s, and the 10-Q attributes it to increased usage growth from existing customers. The product usage increased, not the team size.
So the passive levers were headcount inflation and actual inflation. Customers stopped hiring. Price increases stopped being easy to impose. Both went away at once.
The tough pill to swallow
When these levers stopped working, we hoped for the expansion engine to pick up the slack but there wasn’t one.
There never was one. The metric had been providing for a decade without anyone having to build anything. Then why would anyone build it. Everyone just assumed the engine existed because the numbers kept coming.
I keep thinking about this alongside the MQL, which I went after a few weeks ago for exactly this crime. A number that went up, that everyone reported, that measured effort and got treated as though it measured outcome. NRR is the same con, just told at the other end of the funnel and to a much more senior audience. It measured your customers’ hiring plans and your legal team’s contract templates, and you took it into board meetings as evidence of your GTM motion.
I come with receipts
If you think I am being unfair, here are the two numbers that settle it.
Expanding an existing customer costs $0.80 per dollar of new ARR. Acquiring a new logo costs $1.63. Expansion is, by a distance, the cheapest revenue in your entire business, and it has been the cheapest for years.
And roughly 1 in 5 companies can actually tell you what it costs them. Benchmarkit describes expansion CAC as one of the least-tracked metrics of the last four years, and was pleased that about 20% measured it in 2025. That is the good news version.
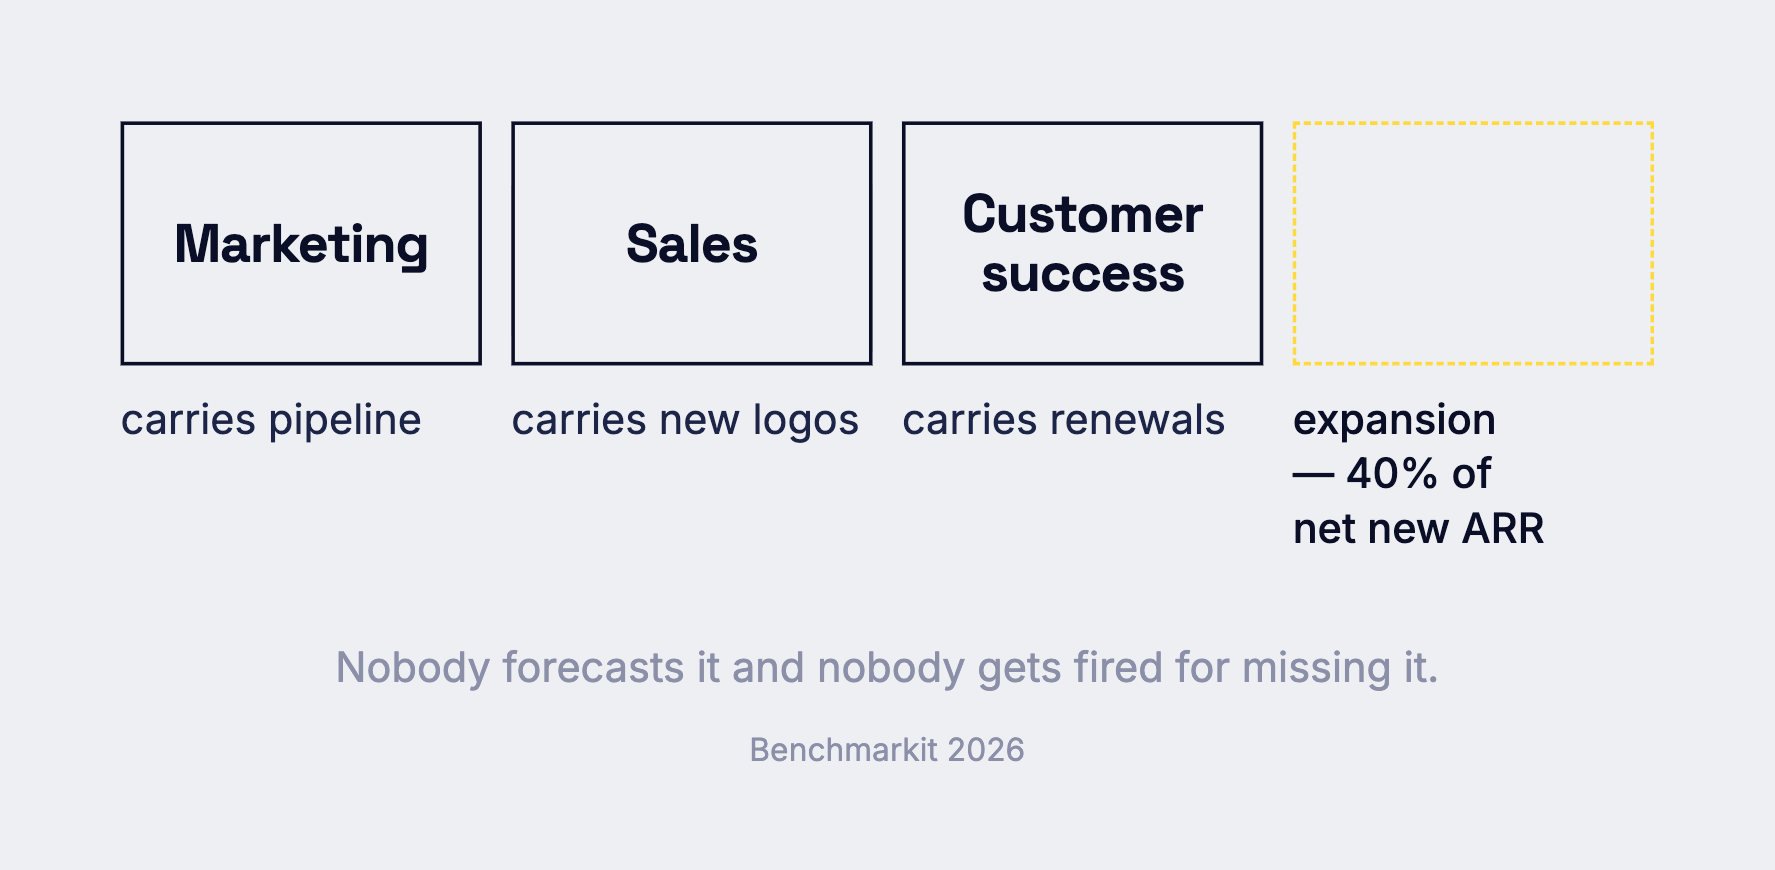
Now go and pull up your own org chart. Go on, I am waiting! Try to find the person whose number this is. Mark from marketing carries the pipeline. Sandra from sales is responsible for new logos. Cathy from CS drives the renewals and gets measured on churn. And boy does Cathy have a stressful time with it! When Cathy prevents a cancellation she has had a good quarter. When Cathy grows an account by 30%, she has had exactly the same good quarter. But when Cathy loses a customer, she has had the worst quarter ever which follows her into her yearly appraisal. None of them have an expansion pipeline. Nobody forecasts it and nobody sure as hell gets fired for missing it.
Meanwhile expansion is now 40% of net new ARR at the median, and 44% for the companies growing slowest. Benchmarkit’s own reading is that once it crosses 40%, expansion has stopped amplifying new logo growth and started substituting for it.
So roughly half of your growth number is coming from a motion that has no owner, no target, no forecast and, in four companies out of five, no idea what it costs.
What I actually think
I think most of the retention panic this year has been aimed at the wrong end of the metric, and that a lot of budget is about to go into churn prediction, health scores and customer success tooling to solve a problem the data does not clearly show you have.
What the data does show, consistently, across every source I could find, is that the growth you used to get for free is gone and nothing has been built to replace it.
If you only do one thing with this, do the boring one. Work out what a dollar of expansion revenue actually costs you, and put that number next to what a dollar of new logo revenue costs you. Most teams have never seen those two figures side by side. When you do, the conversation about where next year’s money goes changes on its own, and you will not need me or a benchmark report to have it for you.
The rest of it, the quota, the pipeline, the owner, follows from that one comparison. It just will not happen until somebody makes it.
Next Monday
I am pulling apart Entrata, which filed to go public in May on the back of 233 customers.
Not 233 thousand. 233. Those accounts are 84% of its revenue, in a category whose underlying market grows about 2% a year, and the whole thing is laid out in an audited filing anyone can read. After a piece built on surveys where companies grade their own homework, a teardown of numbers somebody had to sign for feels like the right follow-up.
If you want it Monday morning, subscribe. It is free.
Monday GTM is a weekly read on how B2B go-to-market actually works, for the people doing the work. No theory, no fluff. Just what holds up when you look closely.