

I have worked as a B2B product marketing manager for the SMB segment, and it was one of my most fulfilling roles. SMBs are a complex segment with so many sub-segments, and the market always looks huge. And there is something meaningful about helping a “small” business reach its goals.
That huge market is where this week starts. The number behind it is true. How it gets used is the problem.
The US has 36.2 million small businesses. The figure comes straight from the Small Business Administration, and it turns up in almost every plan that goes after them. A glossary for B2B sellers calls it one of the highest-volume addressable markets in B2B selling. A market research report turns it into an addressable market for CRM and marketing automation.
You’ve probably seen the slide. 36 million businesses, times a price, times a percentage that feels modest.
Read a couple of lines further down the SBA’s own fact sheet, though, and the market changes shape.
The bit after the headline
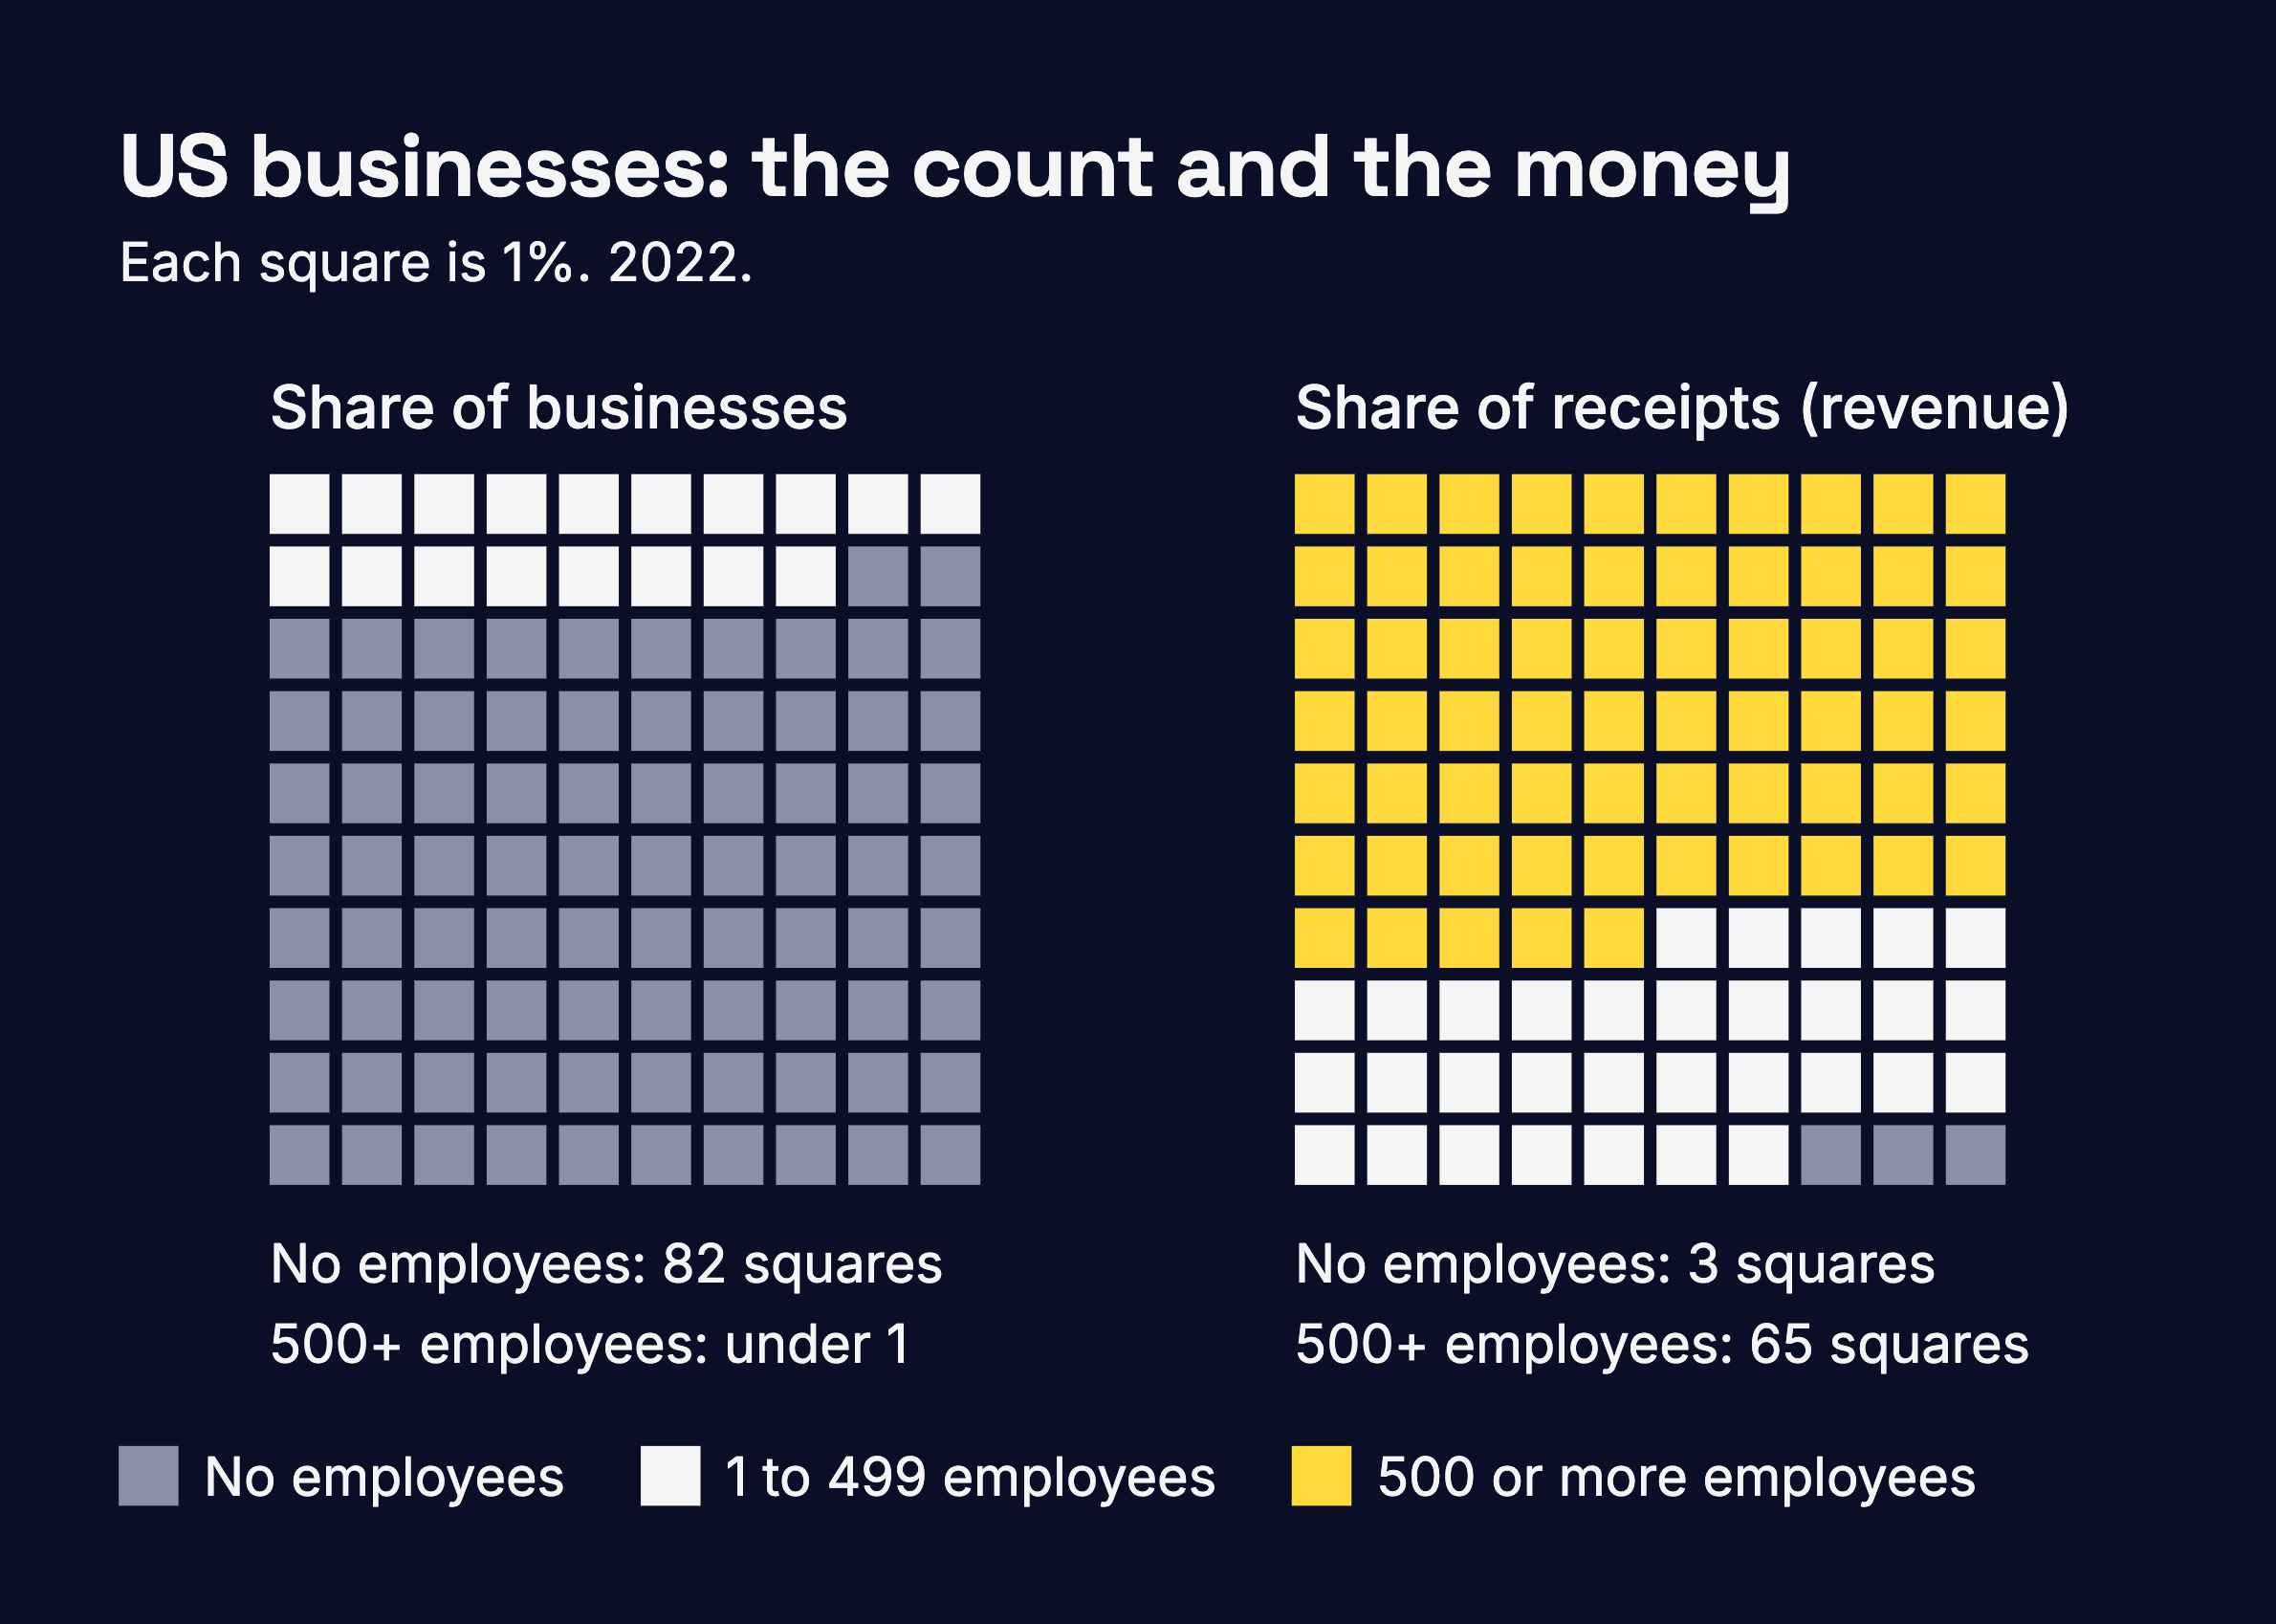
82% of those businesses have no employees at all. That’s 29.8 million of them. The bar for being counted is low: USD 1,000 a year in receipts and a federal tax return. A freelancer with one client counts. So does someone running a small business at weekends.
After that, the numbers thin out fast. There are 5.7 million businesses with 1 to 19 employees, and 654,501 with 20 to 499. At 500 employees and up, there are 21,041.
Now follow the money. The same fact sheet says small businesses, all 36.2 million of them, bring in 35% of private-sector receipts (think revenue). By the SBA’s own split, the other 65% goes to those 21,041 firms.
And the 29.8 million solo businesses? Together they took in USD 1.7 trillion in 2022. That sounds like a lot until you set it against the USD 17.8 trillion that small businesses brought in overall. It’s under a tenth.
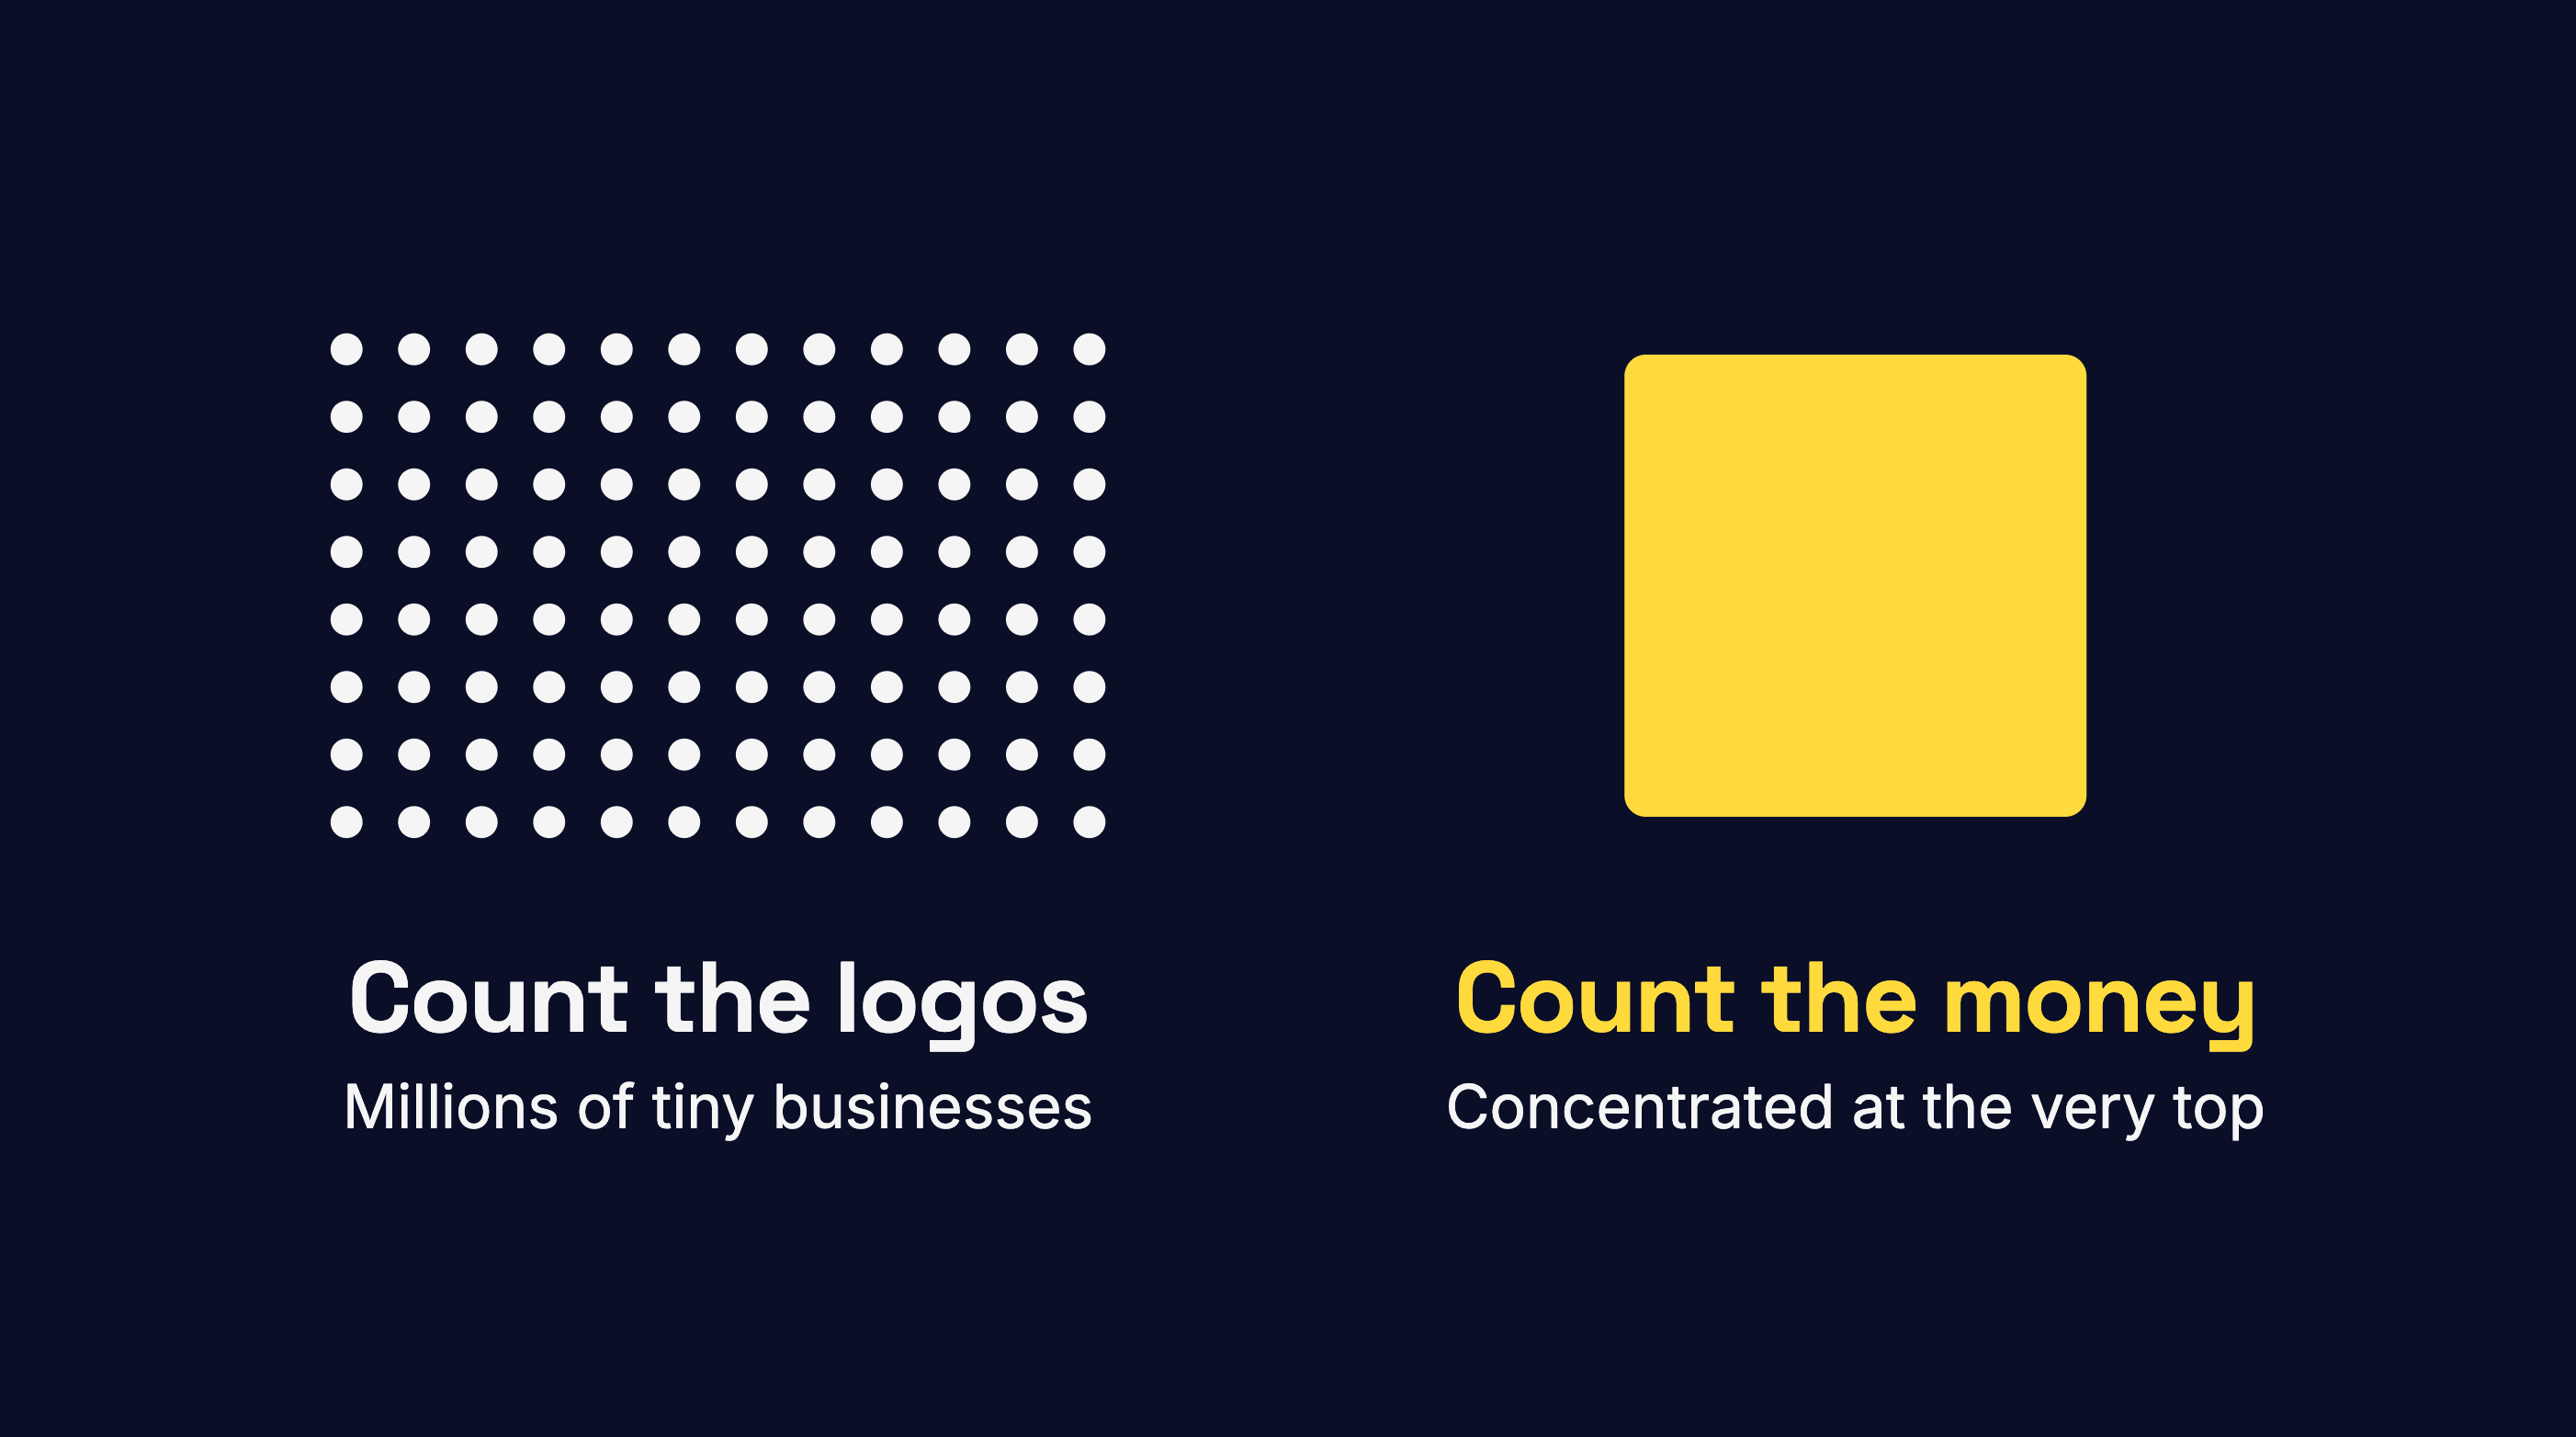
So count the logos, and small business is the whole market. Count the money, and two-thirds of it sits with about 21,000 companies.
None of this makes small business a bad market, and I meant every word at the top. The trouble starts when a plan quotes the count, budgets as if it were the money, and nobody notices until the pipeline comes in.
I checked whether this was an American quirk
It isn’t.
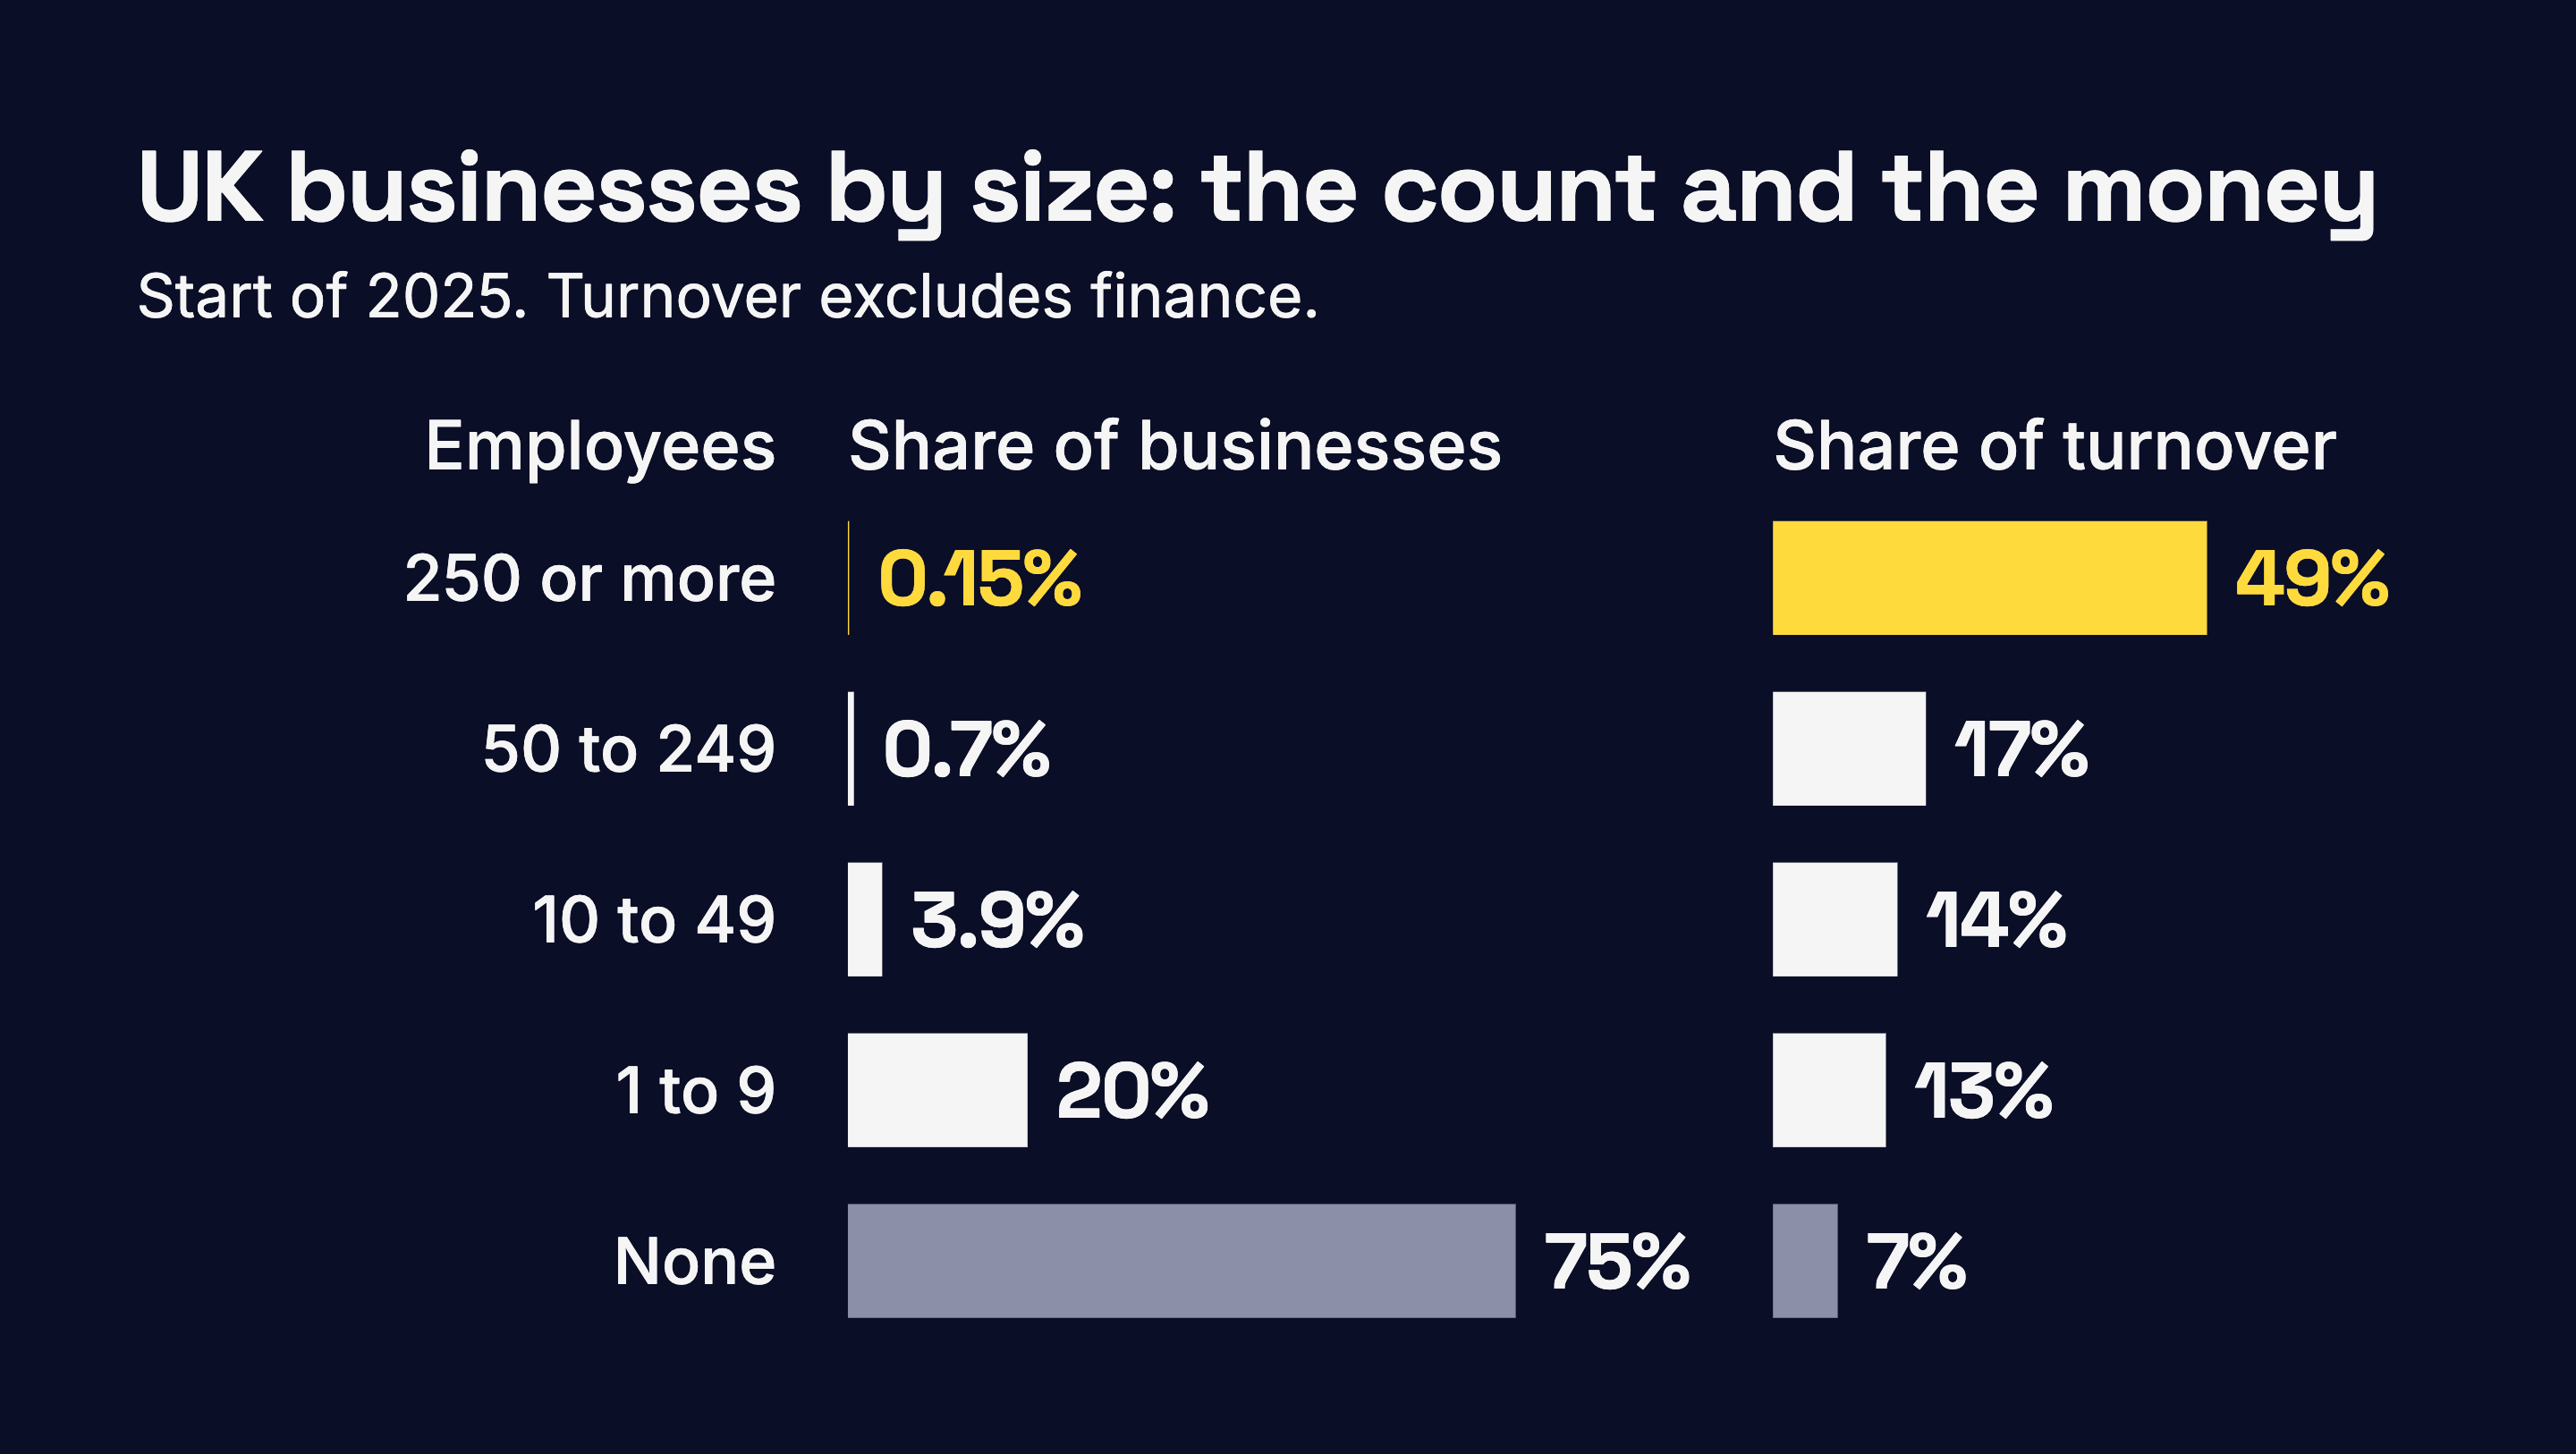
The UK counted 5.69 million private-sector businesses at the start of 2025. Three in four employ nobody besides their owners, and together they bring in about 7% of turnover. The 8,335 large businesses bring in 49%. (Finance is left out of the UK’s turnover figures.)
My favourite line in the UK tables is the middle one. The 38,435 businesses with 50 to 249 employees take 17% of turnover. That’s more than all 1.15 million businesses with 1 to 9 employees put together, at 13%.
The European Union looks almost the same. It measures money differently, as value added, which is roughly what a business sells minus what it buys in from suppliers. In the Commission’s 2025 estimates, large enterprises are 0.2% of all enterprises and produce 48% of it. Eurostat’s final figures for 2023 say 49%.
Singapore sorts its businesses by revenue rather than headcount. In 2024, the 1% of enterprises with revenue above SGD 100 million produced 73% of value added, while the 77% at or under SGD 1 million produced 3%. That top band’s share has been growing, too, from 64% in 2010. That’s Singapore’s own story, though, and I wouldn’t stretch it to anyone else.
That’s four places, three ways of measuring money, and three different ideas of what “large” means. They don’t belong in one table, so I haven’t made one. But on its own terms, each one tells the same story. The count and the money point in opposite directions.
How Europe found 8 million businesses in a year
Here’s why the footnotes matter.
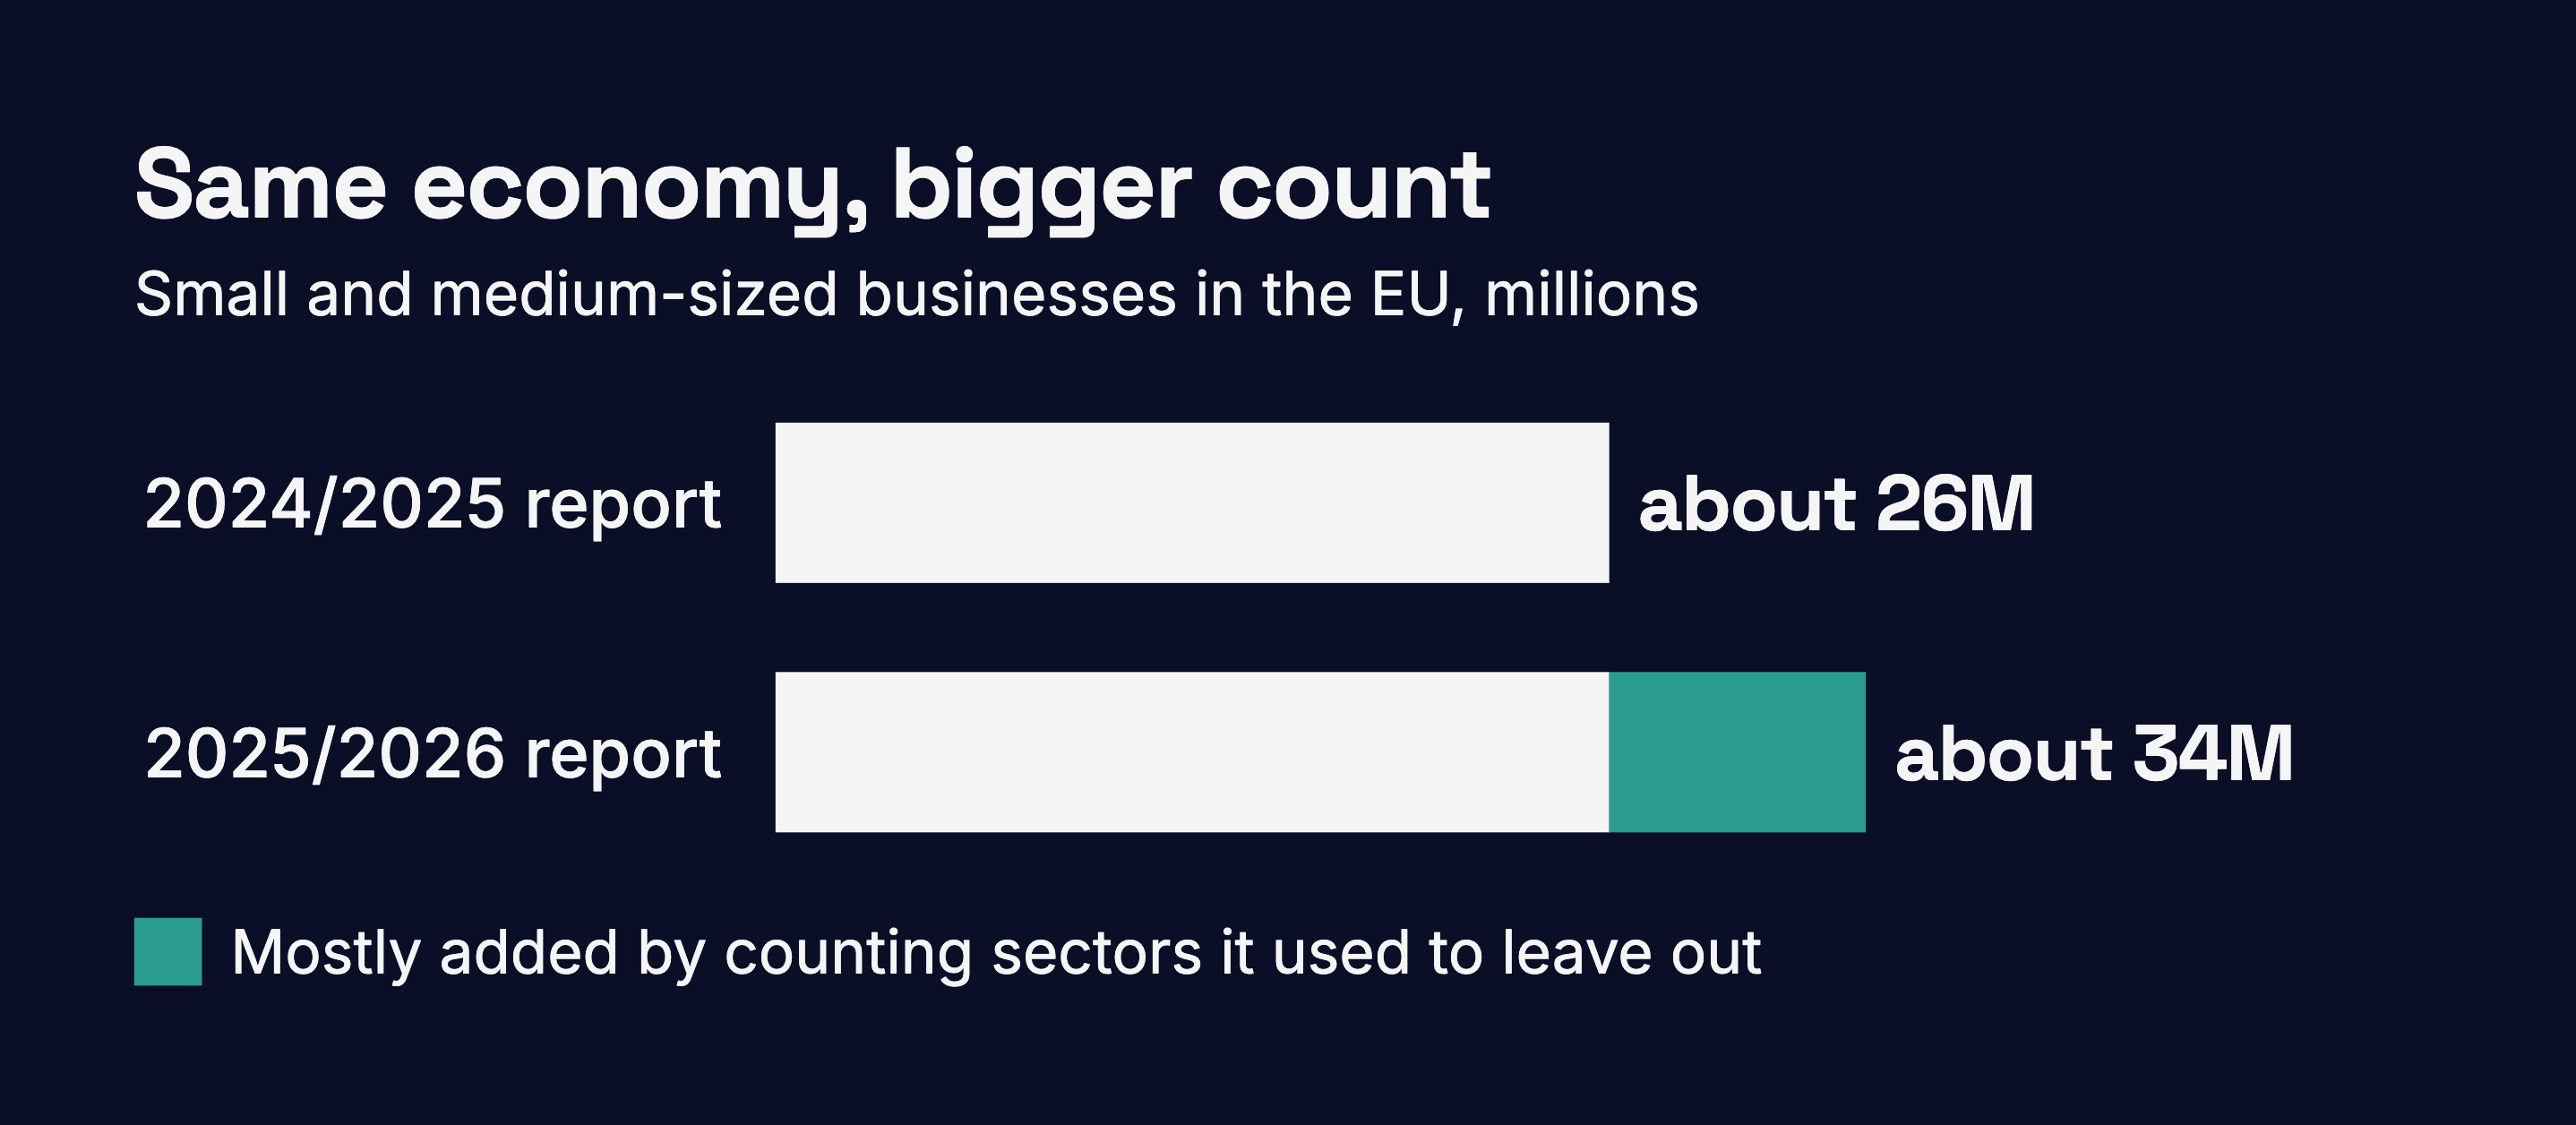
Last year, the European Commission’s annual report on SMEs counted about 26 million of them in the EU. This year’s edition counts about 34 million. Most of that jump isn’t new businesses. The report simply started counting sectors it used to leave out, including finance, education, health and the arts, and it says plainly that this is a break in the series.
Once you start looking, the smaller differences are everywhere. The UK treats a company with one employee as having none, on the assumption that the one employee is the owner. The US counts include nonprofit employers. Singapore sorts by revenue. Each of these choices is reasonable. Put together, they mean a market number with no source, year or definition beside it can’t be defended, however carefully someone multiplied it.
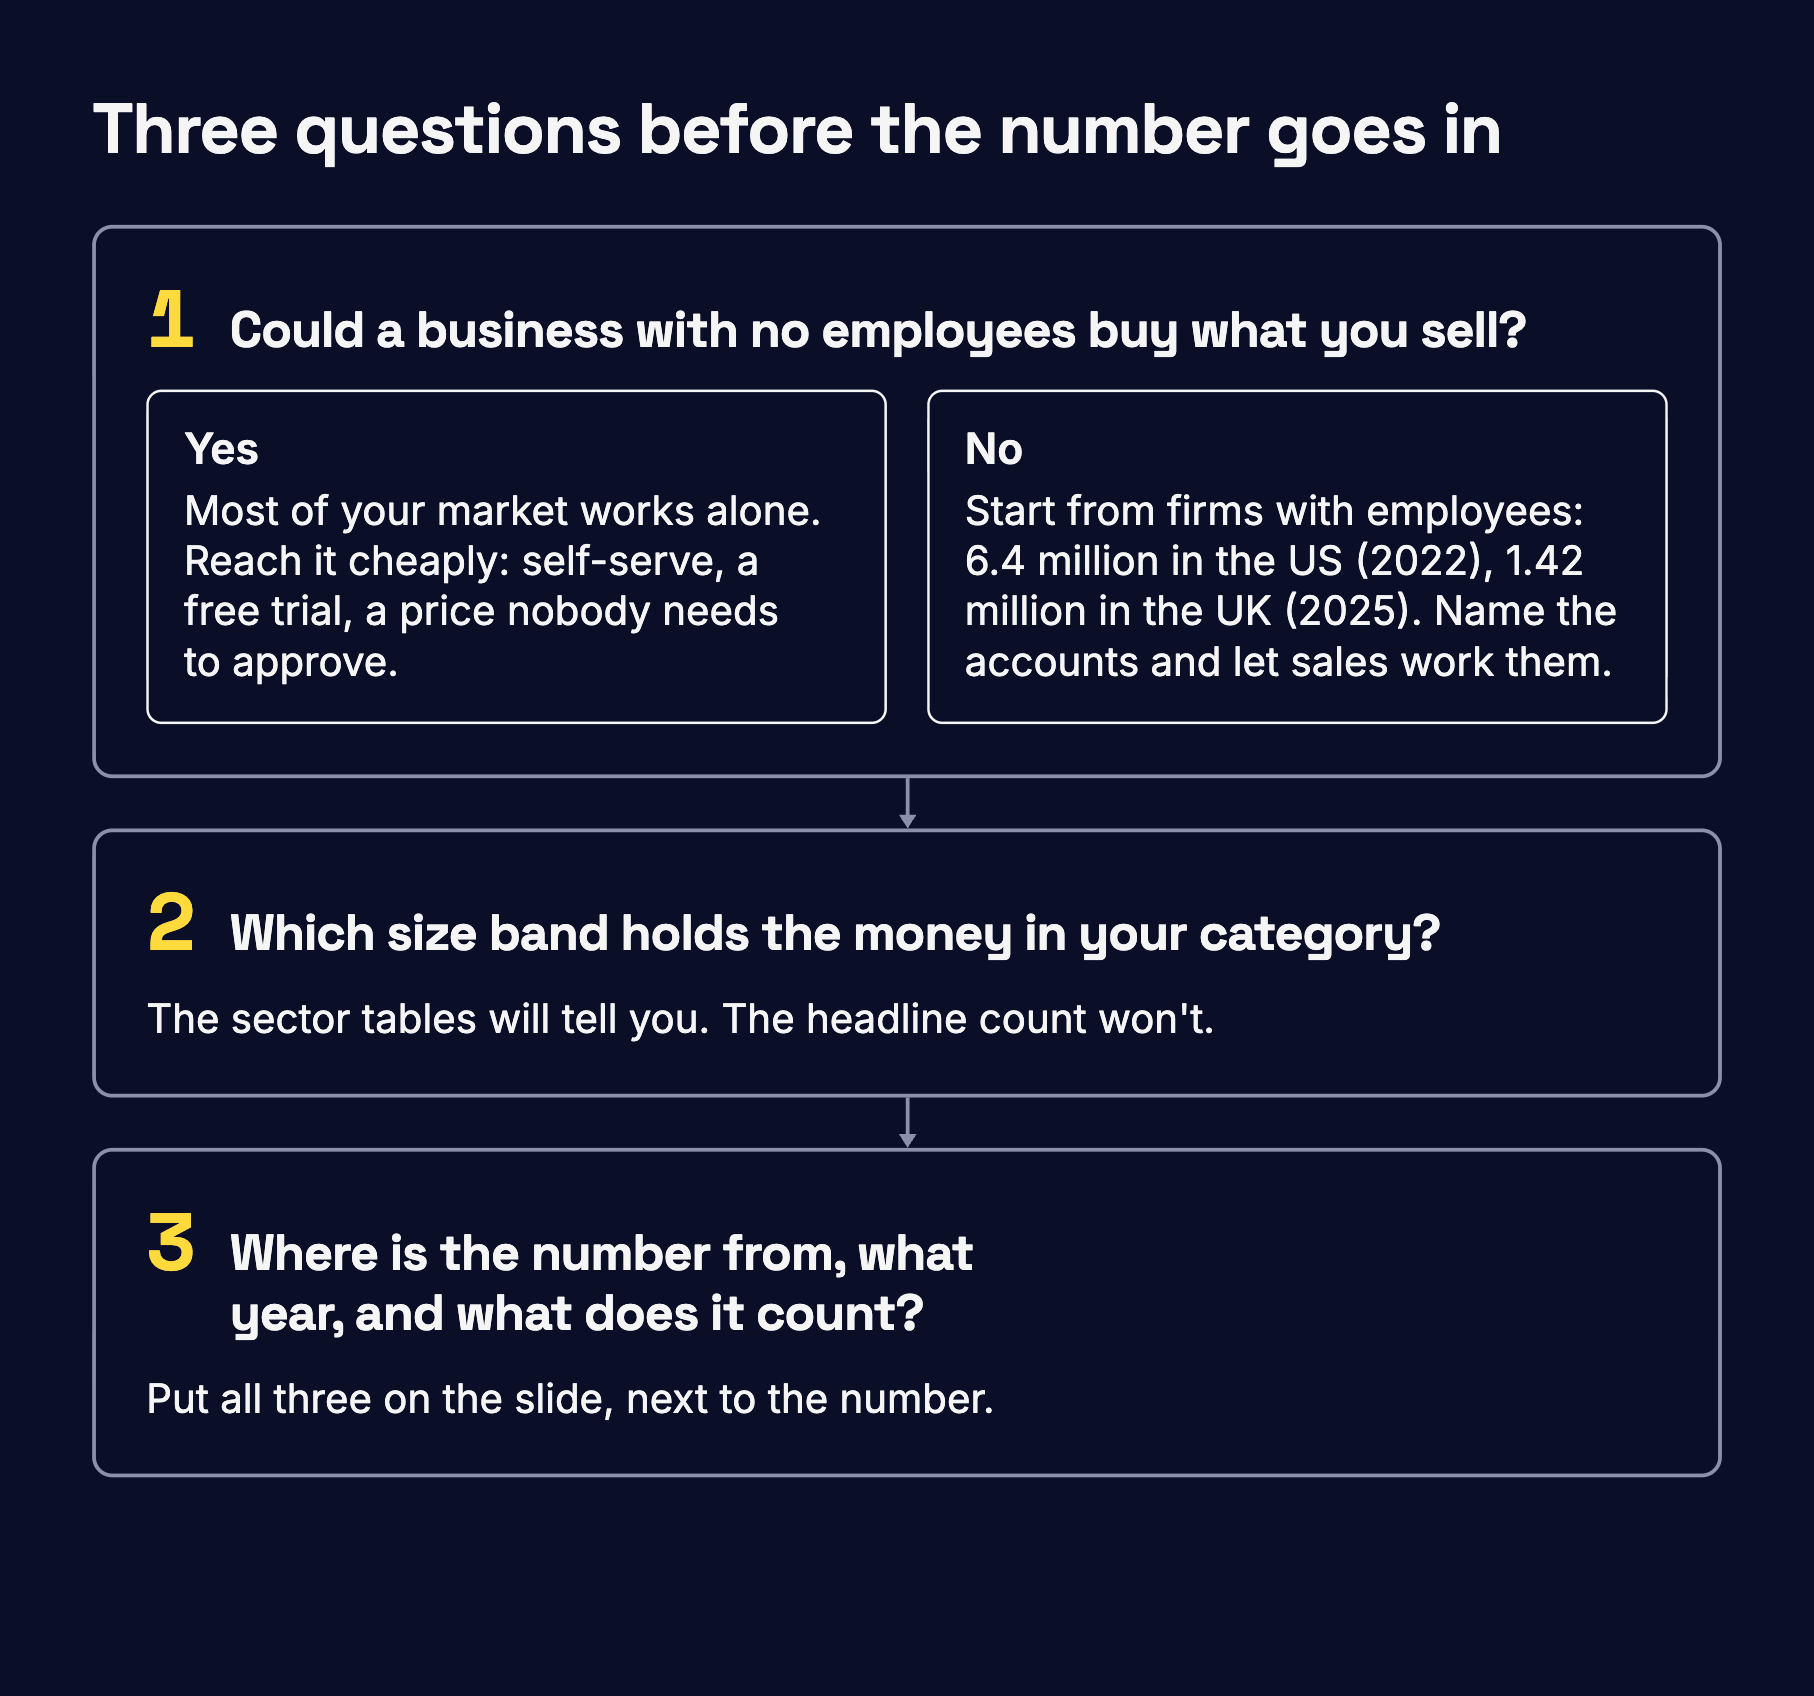
Three questions before the number goes in
Back when I laid out the GTM Canvas, I said a real ICP is a few dozen to a few hundred companies you can actually name. No government count will get you there. What it can tell you is how high the ceiling is, and where the money sits underneath it. Before the number goes into your plan, ask three things.
First, could a business with no employees buy what you sell? If your product needs seats, an admin, a sign-off or a procurement step, probably not. Then your US starting point is the 6.4 million firms with employees, not 36.2 million. In the UK, it’s 1.42 million.
Second, which size band holds the money in your category? The headline won’t tell you, but the sector tables will, and both the SBA and the UK government publish them. Say your product only earns its price above 50 employees. Then the UK’s medium and large businesses are your market. There are 46,770 of them, and between them they take two-thirds of turnover.
The third takes a minute, and it’s the one everybody skips. Put the source, the year and the definition on the slide, right next to the number.
Your answers also change how you sell. If a one-person business can buy from you, most of your market works alone. That crowd has to be reached cheaply, with self-serve, a free trial and a price nobody needs to approve. If it can’t, your market is small enough to name, and naming accounts is where a sales team earns its keep. The expensive mistake is sending the sales team after the crowd.
None of this is a case against ambitious market sizing. When I took apart Entrata’s S-1, its serviceable market was its best customers’ spend multiplied across every multifamily unit in the United States, disclosed properly, footnote and all. A defensible number doesn’t have to be modest. It has to say what it counted.
Next time you sit down to size your SMB market, start from the other end. Take the smallest company that has ever actually paid you, and build up from there.
Tell me about yours. How many people worked there?
If this was useful, subscribe. The weekly issue stays free.
Every figure above comes from the official source linked beside it: the SBA Office of Advocacy (February 2026, 2022 data), the US Census Bureau (2022 data), the UK Department for Business and Trade (October 2025, data for the start of 2025), the European Commission (June 2026, estimates for 2025) and Eurostat (2023 data), and Singapore’s Department of Statistics (March 2026, 2024 data). Checked on 25 September 2026.
Monday GTM is a weekly read on how B2B go-to-market actually works, for the people doing the work. No theory, no fluff. Just what holds up when you look closely.
I write Monday GTM alongside my work at Loop & Ladder, a growth consultancy.
The market looks massive until you realize most of it can’t afford your product.